


 = 5x + 6. Find f(x – 3).")
 = 2x – x2 . Find f(x + 1).")


 Математика
Похожие презентации:


Functions and their graphs
1. Functions and Their Graphs
1.2 – Functions2. Vocab
• Function = A set of ordered pairs that has each input(x) giving exactly one output (y)
• Ex: Function or not?
X
Y
X
Y
X
Y
-2
3
5
3
-2
3
0
4
0
4
0
-1
8
32
8
32
8
-2
7
5
5
-6
7
3
Yes
No;
One input gives 2 outputs
Yes
• In a function, one input can’t give 2 different outputs!
3. More Vocab
(x, y) = (input, output)
f(x) is another way to write an output
Domain = the set of all inputs (x)
Range = the set of all outputs (y)
Ex: For the function f(x) = x – 3 , evaluate the
following:
f ( 3) ( 3) 3
6
▫ f(-3)
▫ f(x+1)
f ( x 1) ( x 1) 3
x 2
4.
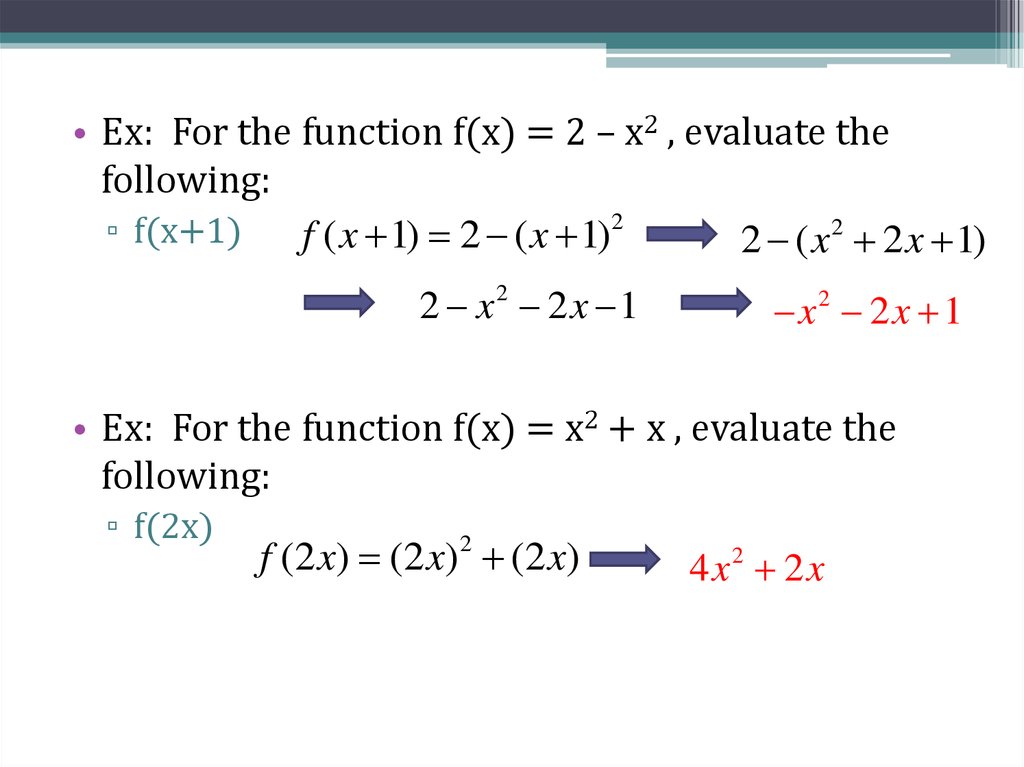
• Ex: For the function f(x) = 2 – x2 , evaluate thefollowing:
▫ f(x+1)
f ( x 1) 2 ( x 1)2
2 ( x 2 2 x 1)
2 x 2x 1
2
x2 2x 1
• Ex: For the function f(x) = x2 + x , evaluate the
following:
▫ f(2x)
f (2 x) (2 x) (2 x)
2
4x2 2x
5.
• Ex: For the function f(x) = x2 – 2x + 3, evaluatethe following:
▫ f(x+h)
f ( x h) ( x h) 2( x h) 3
2
x 2 xh h 2 x 2h 3
2
2
6.
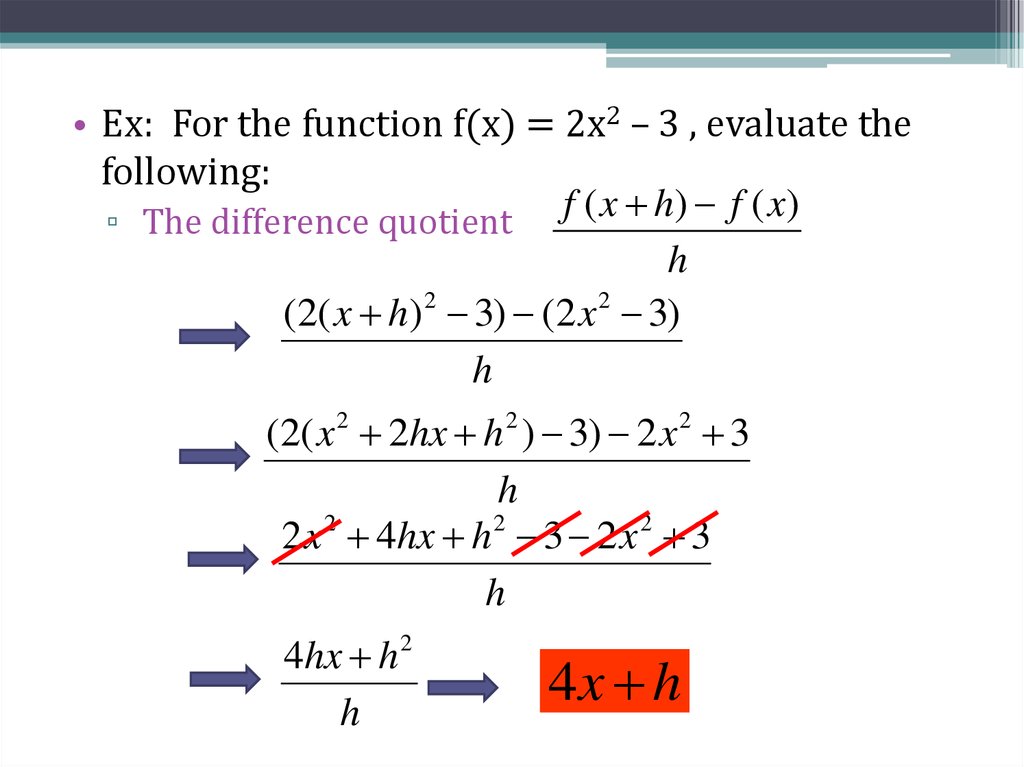
• Ex: For the function f(x) = 2x2 – 3 , evaluate thefollowing:
▫ The difference quotient f ( x h) f ( x)
h
(2( x h) 2 3) (2 x 2 3)
h
(2( x 2 2hx h 2 ) 3) 2 x 2 3
h
2 x 2 4hx h 2 3 2 x 2 3
h
4hx h 2
h
4x h
7. f(x) = 5x + 6. Find f(x – 3).
5x – 35x + 3
5x – 9
5x – 15
15
0%
5x
–
9
0%
5x
–
3
0%
5x
+
3
0%
5x
–
1.
2.
3.
4.
8. f(x) = 2x – x2 . Find f(x + 1).
0%0%
-x
2
+4
x+
-x
2
+2
x+
1
0%
-x
2
+1
0%
3
-x2 + 1
-x2 + 2x + 1
-x2 +4x + 3
-x2
-x
2
1.
2.
3.
4.
9.
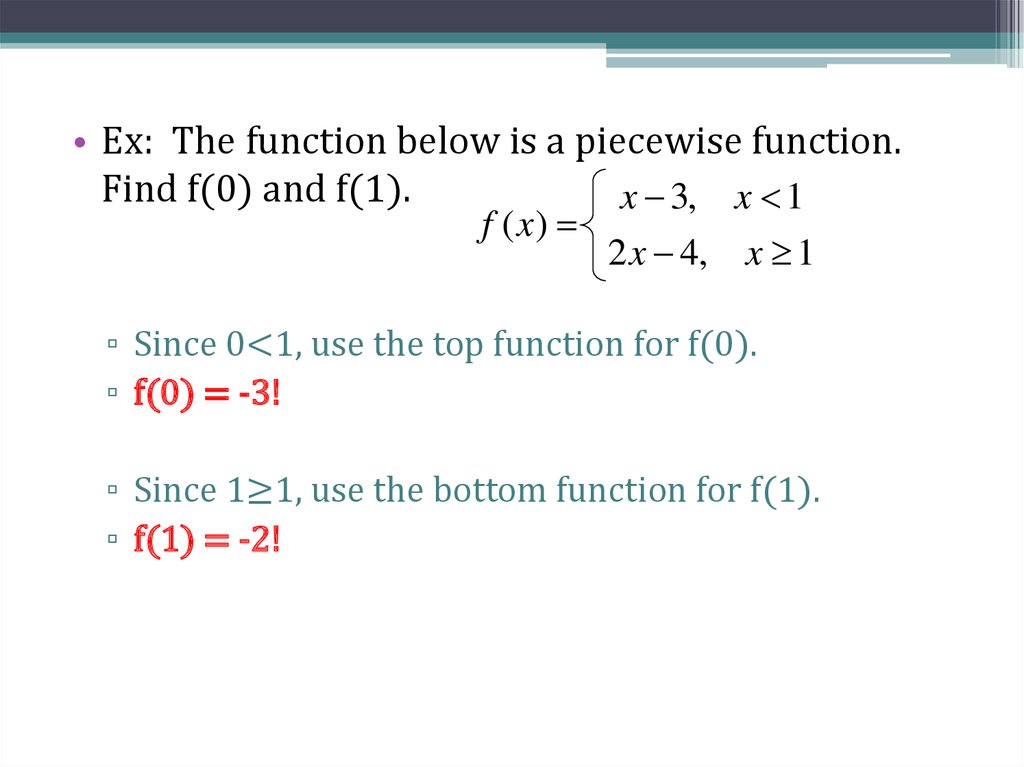
• Ex: The function below is a piecewise function.Find f(0) and f(1).
x 3, x 1
f ( x)
2 x 4, x 1
▫ Since 0<1, use the top function for f(0).
▫ f(0) = -3!
▫ Since 1≥1, use the bottom function for f(1).
▫ f(1) = -2!
10. More Vocab
• y = x2 means y is a function of x• Y is not a function of x when a ± is in play
• Ex: Which of these has y as a function of x?
▫ x2 – y = 7
Solve for y first…
- y = 7 – x2
y = x2 – 7 … no ± means YES!
▫ x2 + y2 = 2x
y2 = 2x – x2
y = 2 x x 2 … so NO!
11. Finding Domain and Range
• The domain (set of all x’s) is always assumed to be allreal numbers unless some values cannot create
outputs (y’s).
• Ex: Find the domain of the following functions:
▫ y = 2x – 3
Any x will produce a y, so the domain is xϵℝ (all reals)
▫ y=
x
The square root can’t be negative, so the domain is x≥0
▫ y=
3
2x 4
The denominator can’t be 0, so 2x – 4 ≠0…
…x≠2
12. Finding Domain and Range
• To find range, graph the function and infer the range(set of all y’s).
• Ex: Find the domain and range of the function y x 3
▫ Graph the function first.
▫ For the domain, we know from the equation given that
x ≥ 3. Our graph confirms that.
▫ For the range, the graph shows us
that there are no negative values
for y, and the values will continue
to increase as x increases.
▫ Range: y ≥ 0
13. What is the domain?
f ( x) 4 x2
What is the domain?
1.
2.
3.
4.
xϵℝ
-2≤x≤2
x≥0
-2<x<2
14. What is the domain?
x 2f ( x)
x 3
What is the domain?
1.
2.
3.
4.
xϵℝ
x ≠ -2
x≠3
x ≠ -2 and x ≠ 3
15. What is the range?
f ( x) 2 x 52
What is the range?
1.
2.
3.
4.
yϵℝ
y≠5
y < -5
y ≥ -5
16. Ch. 1 – Functions and Their Graphs
1.3 – More Functions17. Vertical Line Test
• Vertical is up and down!• Vertical Line Test: If you can draw some vertical line on
a graph and it goes through MORE THAN ONE point,
the graph is NOT a function.
▫ Ex: Are these graphs functions?
YES!
YES!
NO!
18. Vocab
• As we read left to right, the functionto the right is…
▫ …decreasing in the red region
Decreasing for x<-1, so we write ( , 1) to
indicate that y decreases over that x interval
▫ …constant in the blue region
Constant for -1≤x≤2, so we write
( 1, 2)
▫ …increasing in the green region
Increasing for x>2, so we write
(2, )
19. Vocab
• When a function goes from increasing todecreasing (or visa versa), it will have a relative
minimum or a relative maximum.
• The graph below has a relative maximum at (-2, 2)
and a relative minimum at (1, -2).
• A graph can have any amount of
relative minima or maxima.
20. Functions
• A function is even if it issymmetric about the y-axis
▫ f(-x) = f(x)
• A function is odd if it is
symmetric about the origin
▫ f(-x) = -f(x)
• A graph symmetric about the xaxis is…
▫ …not a function!
21. The function y = 4x2 – 2 is…
EvenOdd
None of the above
Not a function
fu
nc
t io
a
No
t
bo
ve
ea
th
of
0%
n
0%
Od
d
0%
No
ne
n
0%
Ev
e
1.
2.
3.
4.
22. The function y = 1/x is…
EvenOdd
None of the above
Not a function
fu
nc
t io
a
No
t
bo
ve
ea
th
of
0%
n
0%
Od
d
0%
No
ne
n
0%
Ev
e
1.
2.
3.
4.
23. The function y = x3 – x is…
EvenOdd
None of the above
Not a function
fu
nc
t io
a
bo
ve
ea
th
0%
n
0%
No
t
0%
of
Ev
e
n
0%
Od
d
Figure it out algebraically –
no graphing!!!
No
ne
1.
2.
3.
4.