


 Английский язык
Похожие презентации:
")


")


Method Validation and Verification Protocols for Test Methods
1. Method Validation and Verification Protocols for Test Methods
2. What is it ?
• Method validation & verification provides objective evidencethat a test method is fit for purpose,
i.e. that the particular requirements for a specific intended
use are fulfilled.
• The term ‘method’ includes kits, individual reagents,
instruments, platforms and software.
• Method Validation : in-house and modified standard methods
• Method Verification : standard methods
3. When it is required ?
• Method Validation : in-house and modified standard methods• Method Verification : standard methods
Method
Fully validated standard
methods
Standard methods –
modifications
Standard methods – outside
their intended scope
Laboratory developed and nonstandard methods
Requirement
Verification
Validation
Validation
Validation
4. Why it is necessary ?
• A test method must be shown to be fit forpurpose by validation and verification for the
customers to gain confidence in the test results
5. Verification
• Standard validated methods - AOAC, ASTM, ISO, etc• Peer accepted methods published in scientific literature
• Commercial test kits
Laboratory needs to verify that analysts using their
equipment in their laboratory environment obtain the
same outcomes as defined in the validation data
6. Verification
• Method performance demonstrated by– blanks or un-inoculated media - to assess contamination;
– laboratory control samples - to assess accuracy;
– duplicates - to assess precision
– calibration check standards - for quantitative analyses
– monitoring quality control samples, and
– participation in a PT testing program
7. Some examples
Methodusing the same type of chromatographic
column from a different manufacturer
a slight change in a non-critical
incubation temperature
use of a different non-selective growth
medium,
differences in details of sample dilutions
as a consequence of expected counts
Requirement
Verification
Verification
Verification
Verification
8. Some examples
Methoduse of a different extraction solvent; use
of HPLC instead of GLC
differences in the formulation of the
selective/differential medium (e.g.
addition of an alternative antibiotic)
different antibiotic concentration to the
base medium
a change to a critical incubation
temperature or time (e.g. 3 days rather
than 5 days incubation)
different confirmation procedure (e.g. use
of an alternative suite of biochemical tests
other than those specified)
Requirement
Validation
Validation
Validation
Validation
Validation
9. Key parameters for verification
TestsFor quantitative results
For trace analyses
For qualitative methods
For diagnostic methods
Parameters
measurement of bias and
measurement of precision minimum requirements
limit of detection (LOD) and
limit of quantification (LOQ)
correlation studies with validated
methods or comparisons with
known outcomes
sensitivity and selectivity
(specificity)
10. Validation
• Non-standard and in-house-developed methods• Scope and validation criteria to be defined and
documented
Tools to demonstrate the method performance
– Blanks
– Certified Reference Material (CRMs)
– Fortified materials
– Replication
– Statistical analysis
11. Types of Validation
Comparative ValidationPrimary Validation
• To demonstrate equivalent
performance between two
methods (validated and
revised analytical method)
• an exploratory process to
establish operational
limits and performance
characteristics for
alternative or new method
12. Validation
Two steps1. to specify what you intend to identify or measure
2. to determine selected performance parameters
13. Validation Parameters
1.2.
3.
4.
5.
6.
7.
8.
9.
10.
11.
12.
13.
Linearity range
Measuring interval
Matrix effects
Selectivity
Sensitivity
Accuracy .
Precision
Repeatability
Reproducibility
Trueness
Limit of detection (LOD) and limit of quantitation (LOQ)
Ruggedness
Measurement Uncertainty.
14. Analytical Performance Characteristics Procedure
• Before validation, design, maintain, calibrate and validate theanalytical system (protocol, conc. range and specified material)
• Train all the personnel who perform the validation testing
• Get approval of method validation protocol from CA before
execution.
1. Specificity
Test procedure: Investigate by injecting of the extracted
sample to demonstrate the absence of interference with the
elution of analyte
Documentation : Print chromatograms.
Acceptance criteria : The excipient compounds must not
interfere with the analysis of the targeted analyte.
15.
2. Linearity• Test procedure :
• Prepare standard solutions at six concentrations, typically 25,
50, 75, 100, 150, and 200% of target conc.
• Analyze three individually prepared replicates at each
concentration.
• Use same method of standard preparation and number of
injections as in the protocol
Documentation:
Record results on a datasheet.
Calculate the mean, standard deviation, and RSD for each conc.
Plot concentration (x-axis) versus mean response (y-axis) for
each conc.
• Calculate the simple regression or weighted regression equation
& correlation coefficient and record.
16.
2. Linearity• Acceptance criteria :
• The correlation coefficient for six conc. levels will be ≥ 0.999 for
the range of 80 to 120% of the target conc.
• The y-intercept must ≤ 2% of the target conc. response.
• A plot of response factor vs conc. must show all values within
2.5% of the target level response factor.
• The coefficient for active ingredients should be ≥ 0.997, for
impurities 0.98 and for biologics 0.95
17.
3. Range• Test procedure :
• Use the data obtained during linearity and accuracy studies to
assess the range of the method.
• We can use the precision data for this assessment, if precision
of the three replicate samples is analyzed at each level in the
accuracy studies.
• Documentation : Record the range on the datasheet.
• Acceptance criteria
Acceptable range (- defined as the conc. interval over which
linearity and accuracy are obtained)
It yields a precision of ≤ 3% RSD.
18.
4. Accuracy• Test procedure
• Prepare spiked samples at three conc. over the range of 50 to
150% of the target conc.
• Analyze three individually prepared replicates at each conc..
• When it is impossible or difficult to prepare known sample,
use a low concentration of a known standard.
• Documentation :
• For each sample, report the theoretical value, assay value, and
percent recovery.
• Calculate the mean, standard deviation, RSD, and percent
recovery for all samples.
• Record results on the datasheet.
19.
4. Accuracy• Acceptance criteria
• The mean recovery will be within 90 to 110% of the
theoretical value for non-regulated products.
• For the U.S. pharmaceutical industry, 100 ± 2% is typical for
an assay of an active ingredient in a drug product over the
range of 80 to 120% of the target concentration.
• Lower percent recoveries may be acceptable based on the
needs of the methods.
• Health Canada states that the required accuracy is a bias of ≤
2% for dosage forms and ≤ 1% for drug substance.
20.
5. Precision - Repeatability• Test procedure:
• Prepare one sample solution containing the target level of analyte
• Make ten replicates from this sample solution
• Documentation:
• Record retention time, peak area, & peak height on datasheet.
• Calculate the mean, standard deviation, and RSD.
• Acceptance criteria:
• FDA states - typical RSD should be 1% for drug substances and
drug products, ± 2% for bulk drugs and finished products.
• HC states - RSD should be 1% for drug substances and 2% for drug
products. For minor components, it should be ± 5% but may reach
10% at the LOQ.
21.
6. Intermediate Precision• Test procedure:
• Demonstrate Intermediate precision (within-laboratory
variation) by two analysts, using two HPLC systems on
different days and evaluate the relative percent purity data
across the two HPLC systems at three conc. levels (50%,
100%, 150%) covering range of 80 to 120%.
• Documentation:
• Record the relative % purity (% area) of each conc. on the
datasheet.
• Calculate the mean, standard deviation, and RSD for operators
and instruments.
• Acceptance criteria:
• The results obtained by two operators using two instruments
on different days should have a statistical RSD ≤ 2%.
22.
7. Limit of Detection• Test procedure
• Determine the lowest concentration of the standard solution
by sequentially diluting the sample.
• Make six replicates from this sample solution.
• Documentation
• Print the chromatogram and record the lowest detectable
concentration and RSD on the datasheet.
• Acceptance criteria
• The International Conference on Harmonization (ICH)
references a signal-to-noise ratio of 3:1.2
• Health Canada recommends a signal-to-noise ratio of 3:1.
• Some analysts calculate the standard deviation of signal (or
response) of a number of blank samples and then multiply
this number by 2 to estimate the signal at LOD
23.
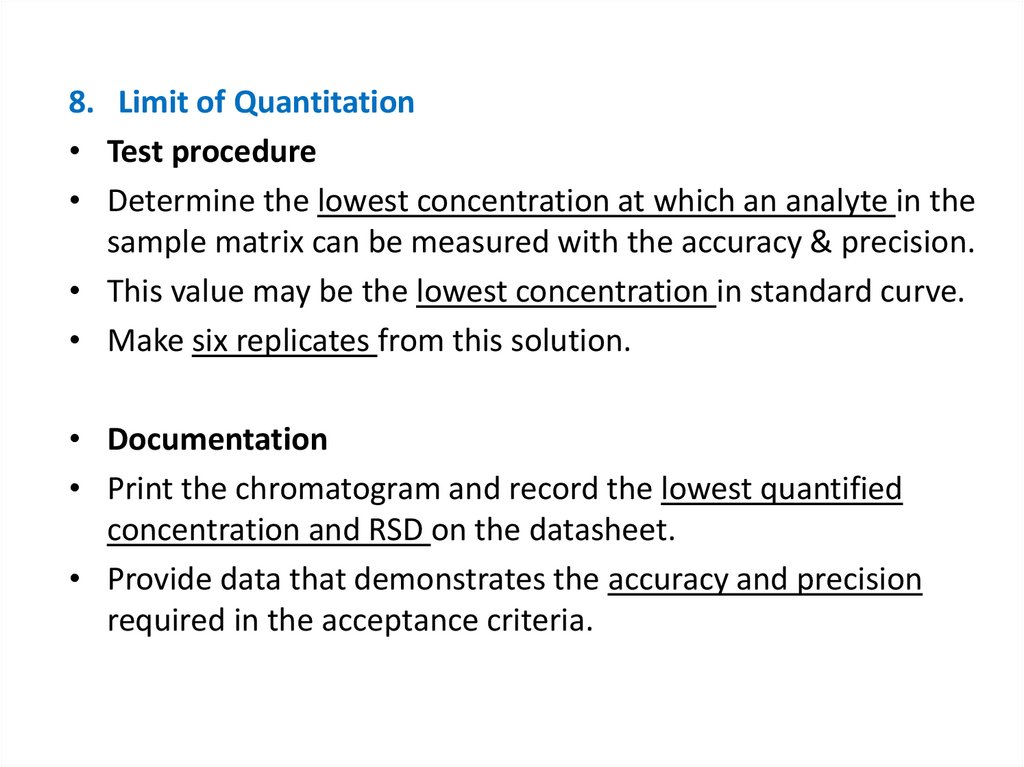
8. Limit of Quantitation• Test procedure
• Determine the lowest concentration at which an analyte in the
sample matrix can be measured with the accuracy & precision.
• This value may be the lowest concentration in standard curve.
• Make six replicates from this solution.
• Documentation
• Print the chromatogram and record the lowest quantified
concentration and RSD on the datasheet.
• Provide data that demonstrates the accuracy and precision
required in the acceptance criteria.
24.
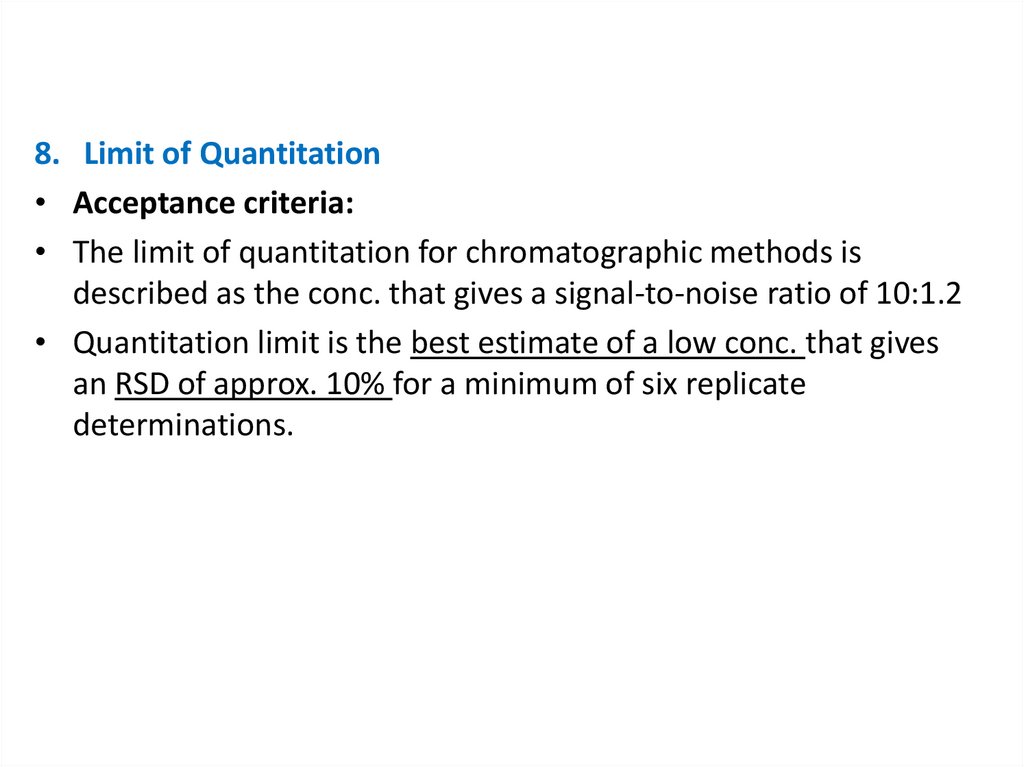
8. Limit of Quantitation• Acceptance criteria:
• The limit of quantitation for chromatographic methods is
described as the conc. that gives a signal-to-noise ratio of 10:1.2
• Quantitation limit is the best estimate of a low conc. that gives
an RSD of approx. 10% for a minimum of six replicate
determinations.
25.
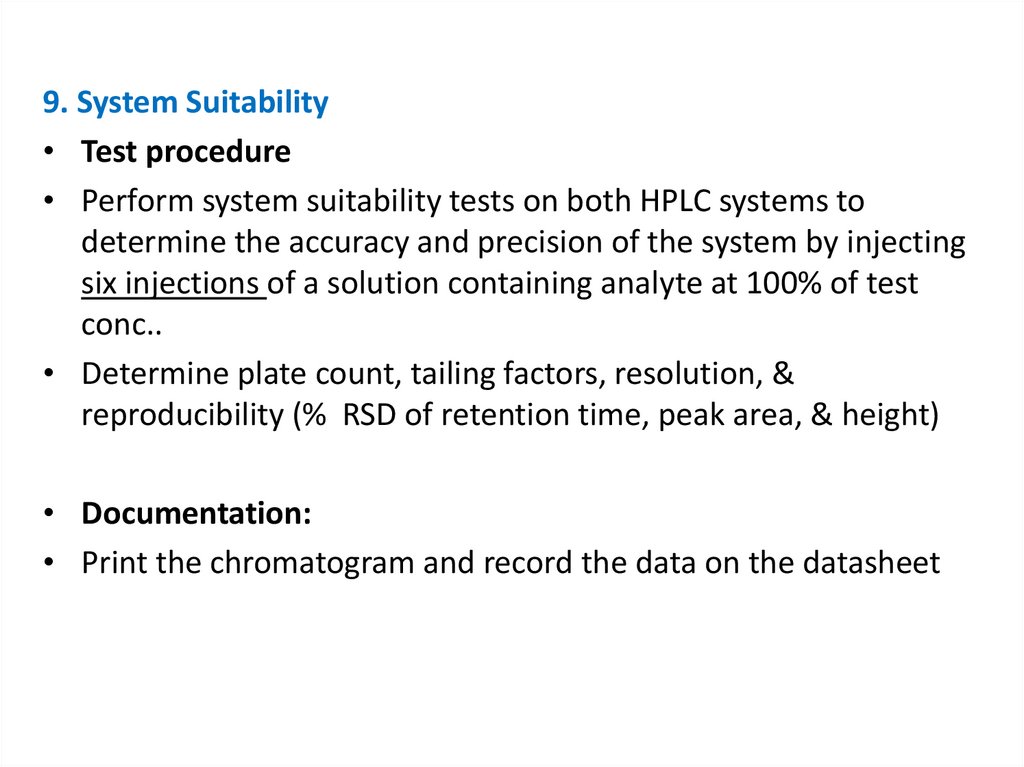
9. System Suitability• Test procedure
• Perform system suitability tests on both HPLC systems to
determine the accuracy and precision of the system by injecting
six injections of a solution containing analyte at 100% of test
conc..
• Determine plate count, tailing factors, resolution, &
reproducibility (% RSD of retention time, peak area, & height)
• Documentation:
• Print the chromatogram and record the data on the datasheet
26.
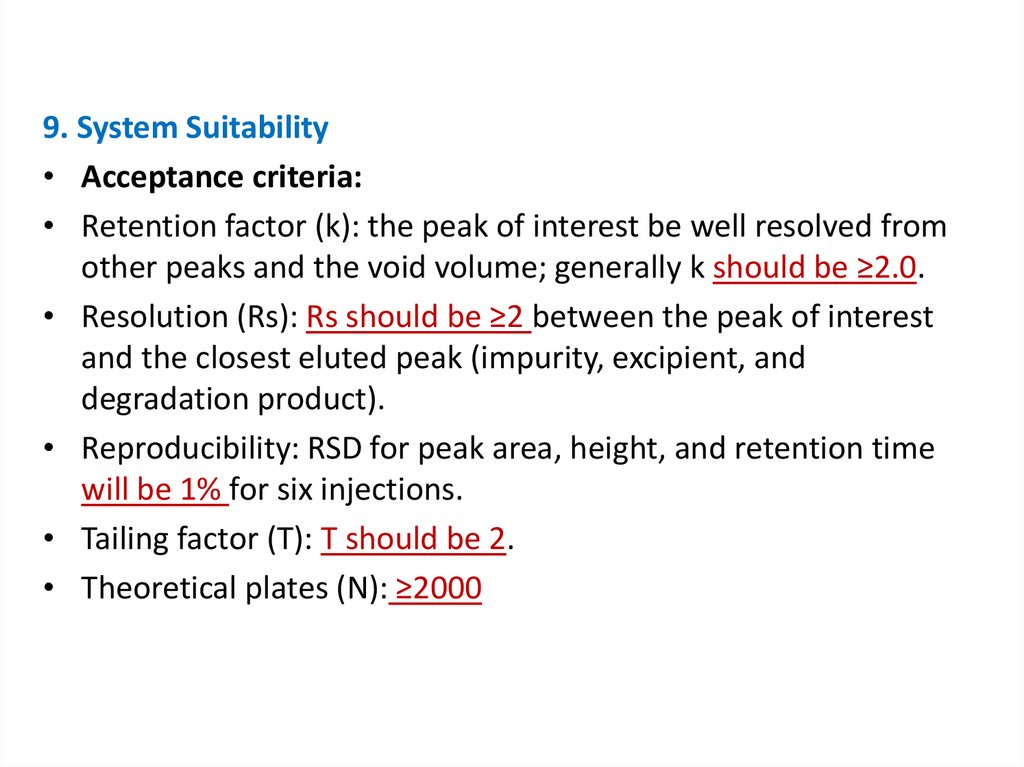
9. System Suitability• Acceptance criteria:
• Retention factor (k): the peak of interest be well resolved from
other peaks and the void volume; generally k should be ≥2.0.
• Resolution (Rs): Rs should be ≥2 between the peak of interest
and the closest eluted peak (impurity, excipient, and
degradation product).
• Reproducibility: RSD for peak area, height, and retention time
will be 1% for six injections.
• Tailing factor (T): T should be 2.
• Theoretical plates (N): ≥2000
27.
10. Robustness• Measures the capacity of an analytical method to remain
unaffected by small but deliberate variations in method
parameters.
• Provides some indication of the reliability of an analytical
method during normal usage.
• Parameters investigated - % organic content in the mobile
phase or gradient ramp, pH of the mobile phase, buffer
concentration, temperature, and injection volume.
• Evaluate these parameters - one factor at a time or
simultaneously as part of a factorial experiment.
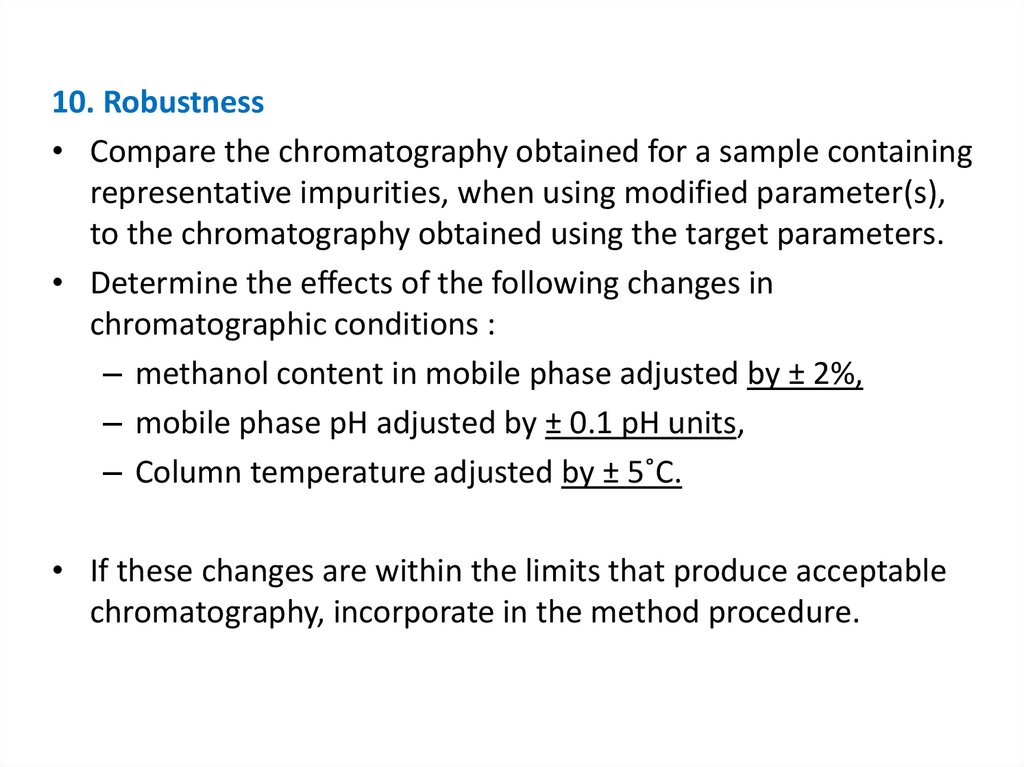
28.
10. Robustness• Compare the chromatography obtained for a sample containing
representative impurities, when using modified parameter(s),
to the chromatography obtained using the target parameters.
• Determine the effects of the following changes in
chromatographic conditions :
– methanol content in mobile phase adjusted by ± 2%,
– mobile phase pH adjusted by ± 0.1 pH units,
– Column temperature adjusted by ± 5˚C.
• If these changes are within the limits that produce acceptable
chromatography, incorporate in the method procedure.
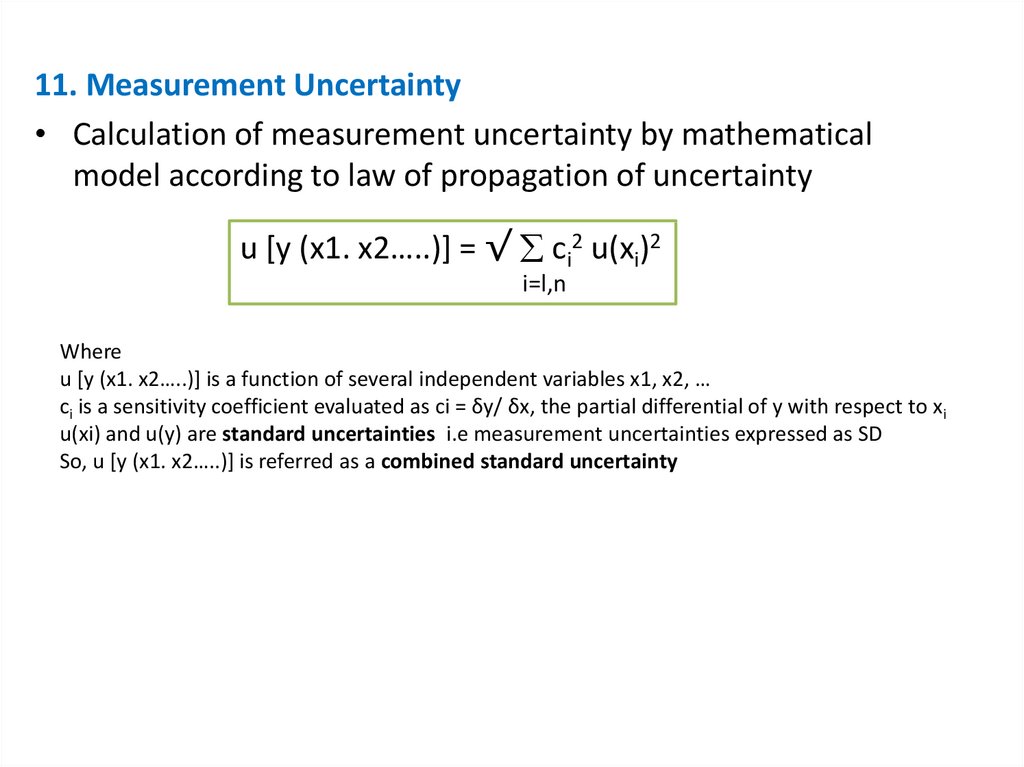
29.
11. Measurement Uncertainty• Calculation of measurement uncertainty by mathematical
model according to law of propagation of uncertainty
u [y (x1. x2…..)] = √ ci2 u(xi)2
i=l,n
Where
u [y (x1. x2…..)] is a function of several independent variables x1, x2, …
ci is a sensitivity coefficient evaluated as ci = δy/ δx, the partial differential of y with respect to xi
u(xi) and u(y) are standard uncertainties i.e measurement uncertainties expressed as SD
So, u [y (x1. x2…..)] is referred as a combined standard uncertainty
30.
Estimation of UncertaintyUncertainty calculation for Chloramphenicol analysis
• Type A and Type B errors are the sources to calculate uncertainty.
• Type A – Due to sample (Repeatability Measurement) (URep)
• Type B – a). Due to Equipments (UEquip)
b). Due to Purity of Chemicals and CRM (UPur)
c). Due to Glassware (Ug)
• Coverage factor k = 2 at 95 % confidence level.
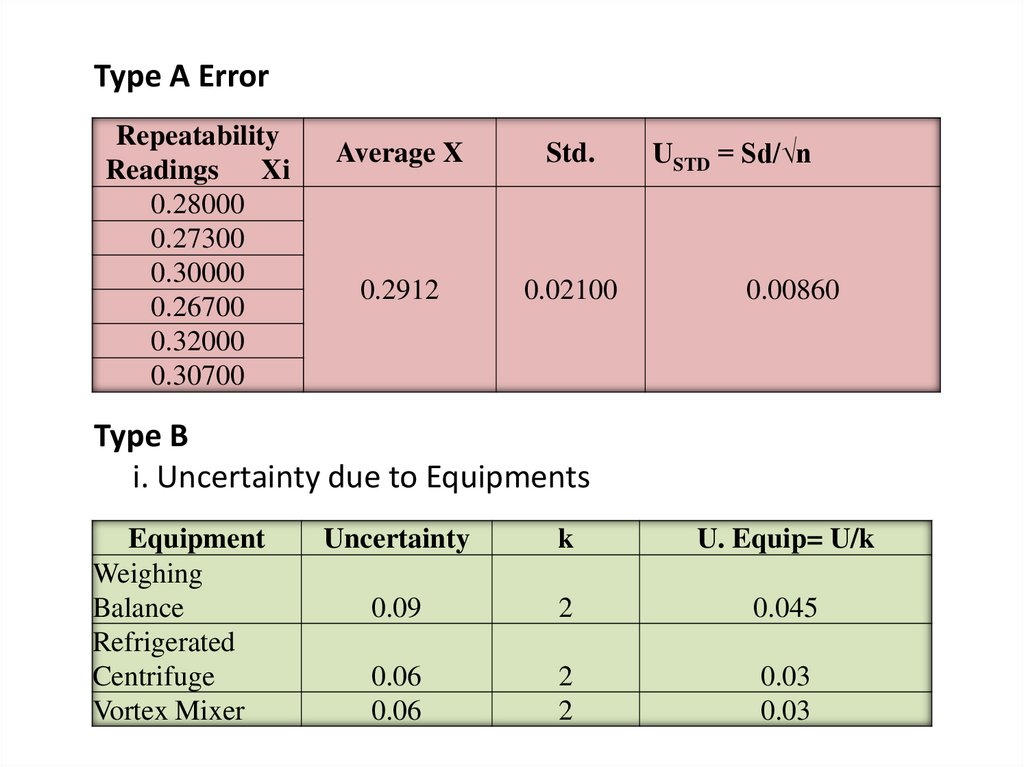
31.
Type A ErrorRepeatability
Readings Xi
0.28000
0.27300
0.30000
0.26700
0.32000
0.30700
Average X
Std.
0.2912
0.02100
USTD = Sd/√n
0.00860
Type B
i. Uncertainty due to Equipments
Equipment
Weighing
Balance
Refrigerated
Centrifuge
Vortex Mixer
Uncertainty
k
U. Equip= U/k
0.09
2
0.045
0.06
0.06
2
2
0.03
0.03
32.
ii. Uncertainty due to Chemicals and CRM (Upur)Chemical
Purity U.
% Conv = U
% Chem %
Chloramphenic
ol (CRM)
99.7
Acetonitrile
99.9
Carbon
Tetrachloride
99
Ethyl Acetate
99.7
k
Std Uncertainty =
U/k
0.3
0.1
0.003
0.001
2
1.732
0.0015
0.0006
1
0.3
0.01
0.003
1.732
1.732
0.0058
0.0017
iii. Due to Standard Uncertainty Glassware (Ug)
Glassware
Volumentric Flask (UVol)
Measuring Cylinder
Micro Pipette (UPip)
Micro Pipette (UPip)
Micro Pipette (UPip)
Capacity
10 ml
25 ml
1000 µl
100 µl
20 µl
Std Uncertainity
0.00200
0.00200
0.11000
0.01000
0.09500
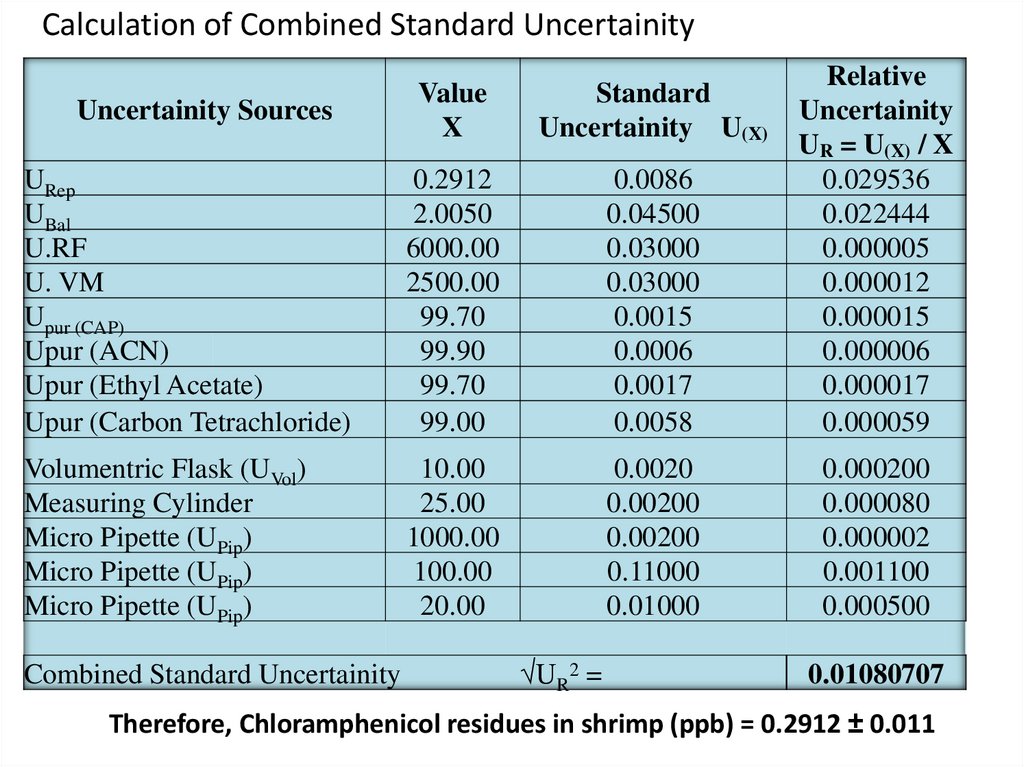
33.
Calculation of Combined Standard UncertainityValue
X
Standard
Uncertainity U(X)
URep
UBal
U.RF
U. VM
Upur (CAP)
Upur (ACN)
Upur (Ethyl Acetate)
Upur (Carbon Tetrachloride)
0.2912
2.0050
6000.00
2500.00
99.70
99.90
99.70
99.00
0.0086
0.04500
0.03000
0.03000
0.0015
0.0006
0.0017
0.0058
Relative
Uncertainity
UR = U(X) / X
0.029536
0.022444
0.000005
0.000012
0.000015
0.000006
0.000017
0.000059
Volumentric Flask (UVol)
Measuring Cylinder
Micro Pipette (UPip)
Micro Pipette (UPip)
Micro Pipette (UPip)
10.00
25.00
1000.00
100.00
20.00
0.0020
0.00200
0.00200
0.11000
0.01000
0.000200
0.000080
0.000002
0.001100
0.000500
Uncertainity Sources
Combined Standard Uncertainity
√UR2 =
0.01080707
Therefore, Chloramphenicol residues in shrimp (ppb) = 0.2912 ± 0.011