

")
")
")


 Информатика
Похожие презентации:
")
")
")
")
")


Modelling and Simulation IS 331. Lec (2)
1. IS 331
Faculty of Information TechnologyFall 2020
Modelling and Simulation
IS 331
Lec (2)
By Dr. Alaa Zaghloul
2. Recap: Performance Evaluation
PerformanceEvaluation
Performance
Measurement
Performance
Modeling
Analytic Modeling
2
Simulation
3. Simulation Model Taxonomy (preview)
34. Terminology (1 of 2)
• A system is defined as a group of objects thatinteract with each other to accomplish some
purpose
– A computer system: CPU, memory, disk, bus, NIC
– An automobile factory: Machines, components parts
and workers operate jointly along assembly line
• A system is often affected by changes occurring
outside the system: system environment
– Hair salon: arrival of customers
– Warehouse: arrival of shipments, fulfilling of orders
• Effect of supply on demand: relationship between factory
output from supplier and consumption by customers
4
5. Terminology (2 of 2)
• Entity– An object of interest in the system: Machines in
factory
• Attribute
– The property of an entity: speed, capacity, failure rate
• State
– A collection of variables that describe the system in
any time: status of machine (busy, idle, down,…)
• Event
– An instantaneous occurrence that might change the
state of the system: breakdown
5
6. When Simulation Is Not Appropriate
• When the problem can be solved by commonsense
• When the problem can be solved analytically
• When it is easier to perform direct
experiments
• When cost of simulations exceeds (expected)
savings for the real system
• When system behavior is too complex (e.g.,
humans)
6
7. Types of Simulations
7
Monte Carlo simulation
Time-stepped simulation
Trace-driven simulation
Discrete-event simulation
Continuous simulation
8. Simulation Model Taxonomy
89. Simulation Examples
• Monte Carlo simulation– Estimating π
– Craps (dice game)
• Time-stepped simulation
– Mortgage scenarios
• Trace-driven simulation
– Single-server queue (ssq1.c)
• Discrete-event simulation
– Witchcraft hair salon
9
10. Simulation Examples
• Monte Carlo simulation–Estimating π
–Craps (dice game)
10
11. Monte Carlo Simulation
Named after Count Montgomery de Carlo, whowas a famous Italian gambler and randomnumber generator (1792-1838).
• Static simulation (no time dependency)
• To model probabilistic phenomenon
• Can be used for evaluating non-probabilistic
expressions using probabilistic methods
• Can be used for estimating quantities that are “hard”
to determine analytically or experimentally
11
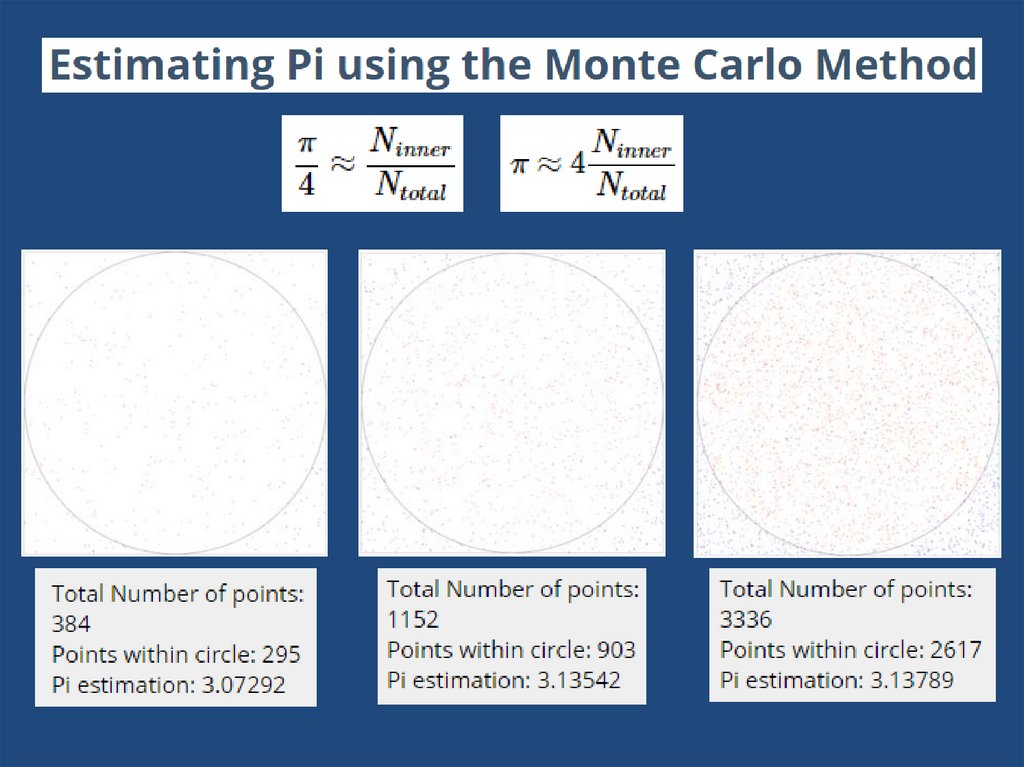
12. Classic Example
Find the value of ?Use the reject and accept method
Or hit and miss method
The area of square=(2r)²
The area of circle = r²
area of square 4r 4
area of circle r
2
2
area of circle
4*
area of square
13.
14.
15.
16.
17.
18.
19. Simulation Examples
• Monte Carlo simulation–Estimating π
–Craps (dice game)
19
20. Monte Carlo Simulation of the Craps Dice Game
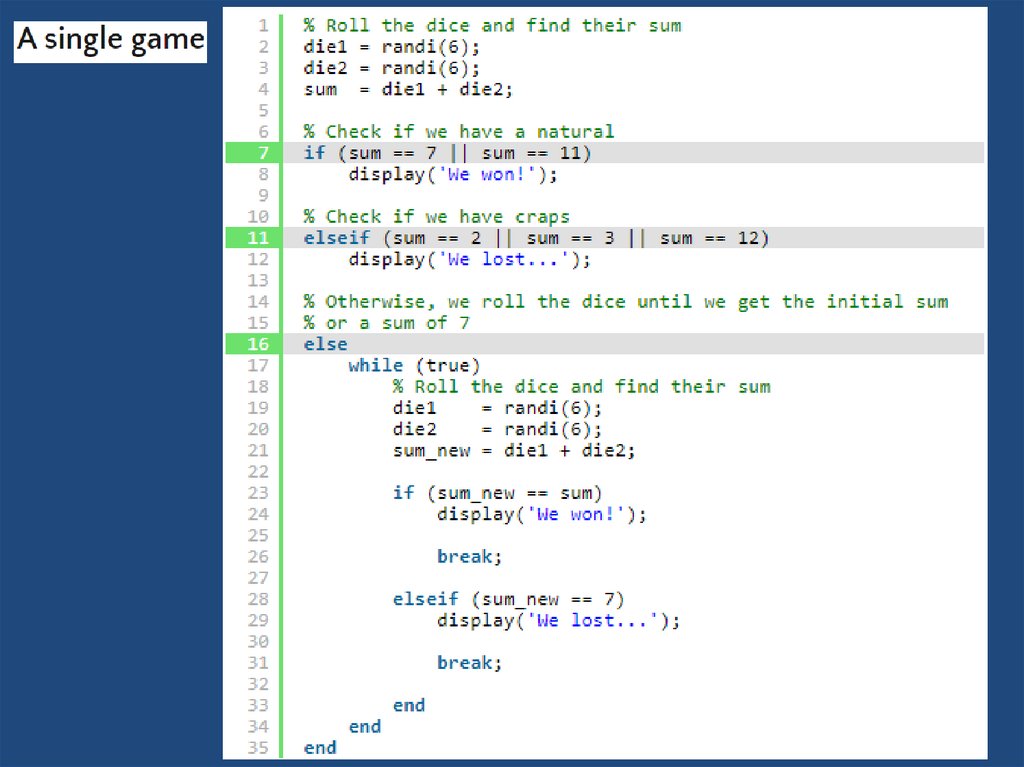
21. Basics
• The player rolling the dice is the "shooter". Shootersfirst throw in a round of Craps is called the Come Out
roll. If you roll a 7 or 11, you win and the round is
over before it started.
• If you roll a 2, 3, or 12 that's a Craps and you lose:
again, it's over before it started.
• Any other number becomes the Point. The purpose
of the Come Out roll is to set the Point, which can be
any of 4, 5, 6, 8, 9 or 10.
22. Objective
• The basic objective in Craps is for the shooter to winby tossing the Point again before he tosses a 7. That
7 is called Out 7 to differentiate it from the 7 on the
Come Out roll.
• If the Point is tossed, the shooter and his fellow
bettors win and the round is over. If the shooter
tosses Out 7, they lose and the round is over.
• If the toss is neither the Point nor Out 7, the round
continues and the dice keep rolling.
23. Craps Game
Come Out RollWin if 7, 11
Set Point
Lose if 2, 3, 12
Win if Point
Continue otherwise
Lose if 7 (Out 7)
Win if Point
Continue otherwise
Lose if 7 (Out 7)
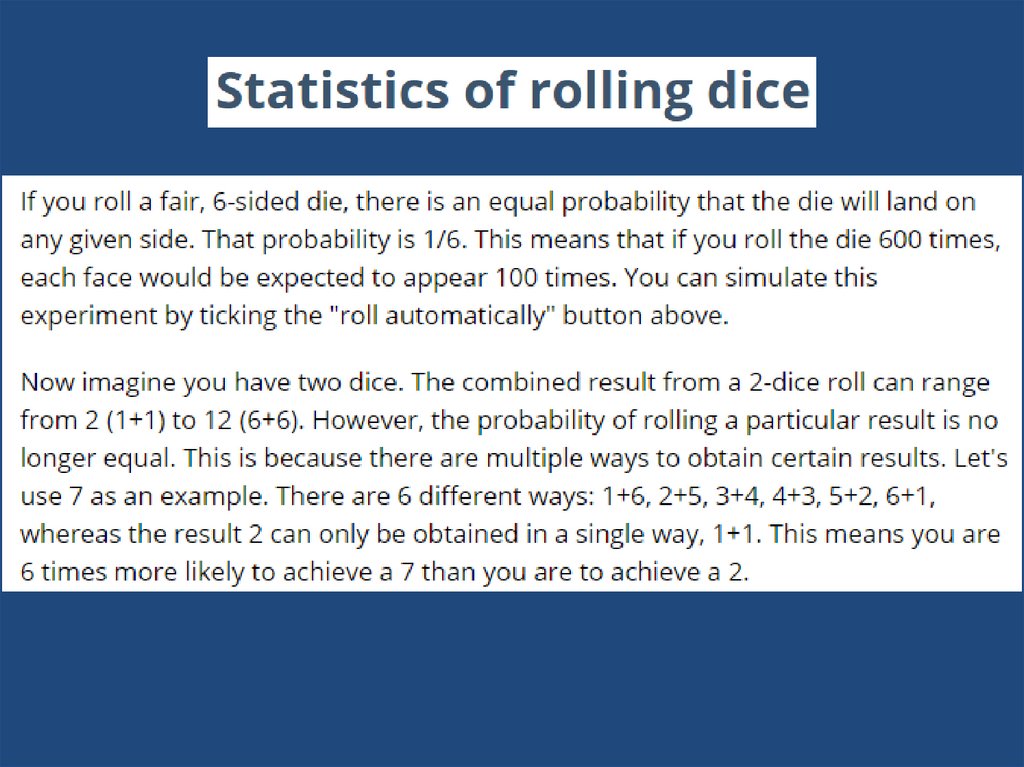
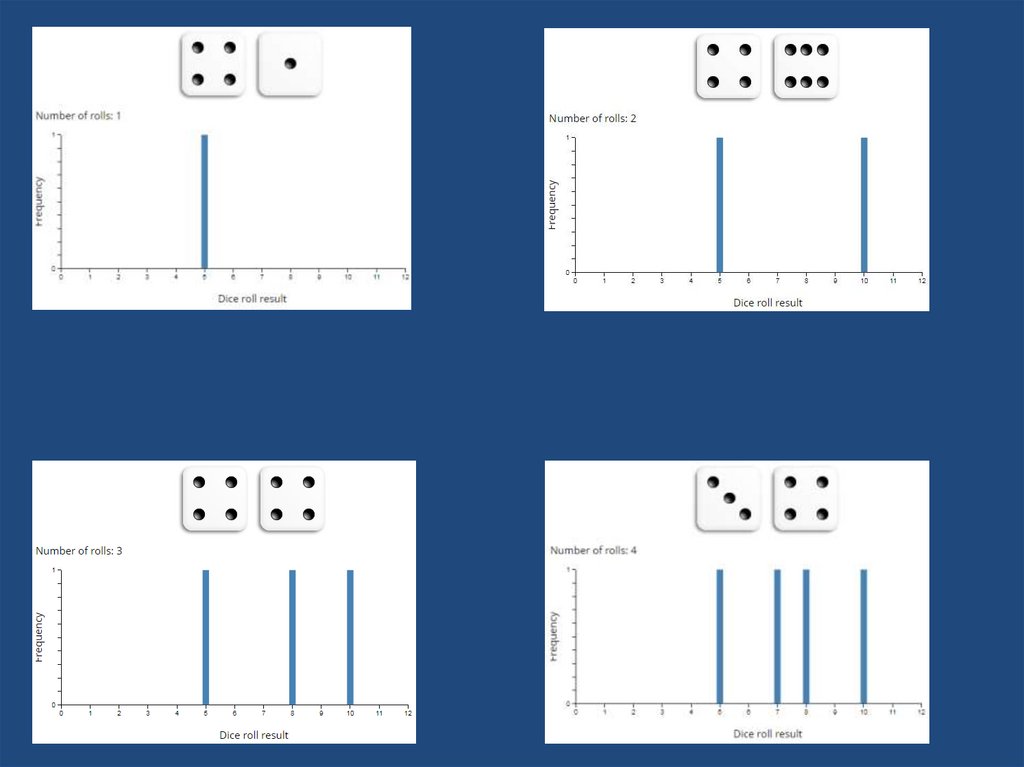
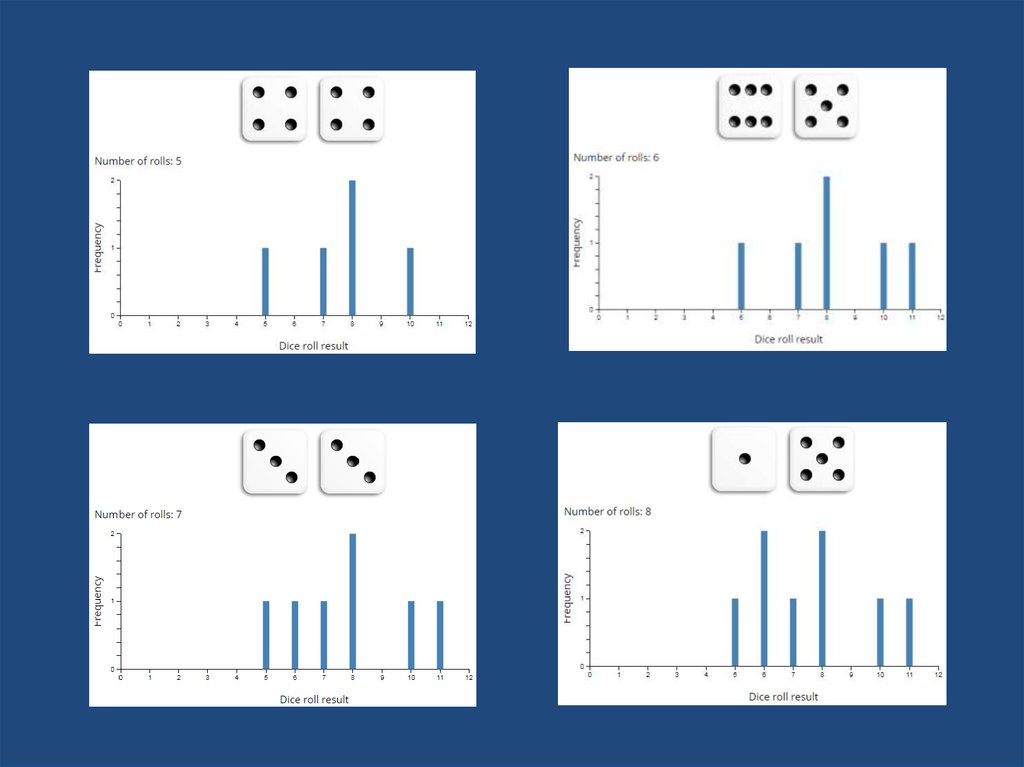
24. Questions
• What is the probability that the roller wins?– Note that this is not a simple problem.
• The probability of win at later rolls depends on the
point value, e.g., if the point is 8, P(8)=5/36
({2,6},{3,5},{4,4},{5,3},{6,2}) and if the point is 10,
P(10)=1/36 ({5,5}).
• How many rolls (on the average) will the game
last?
25.
26.
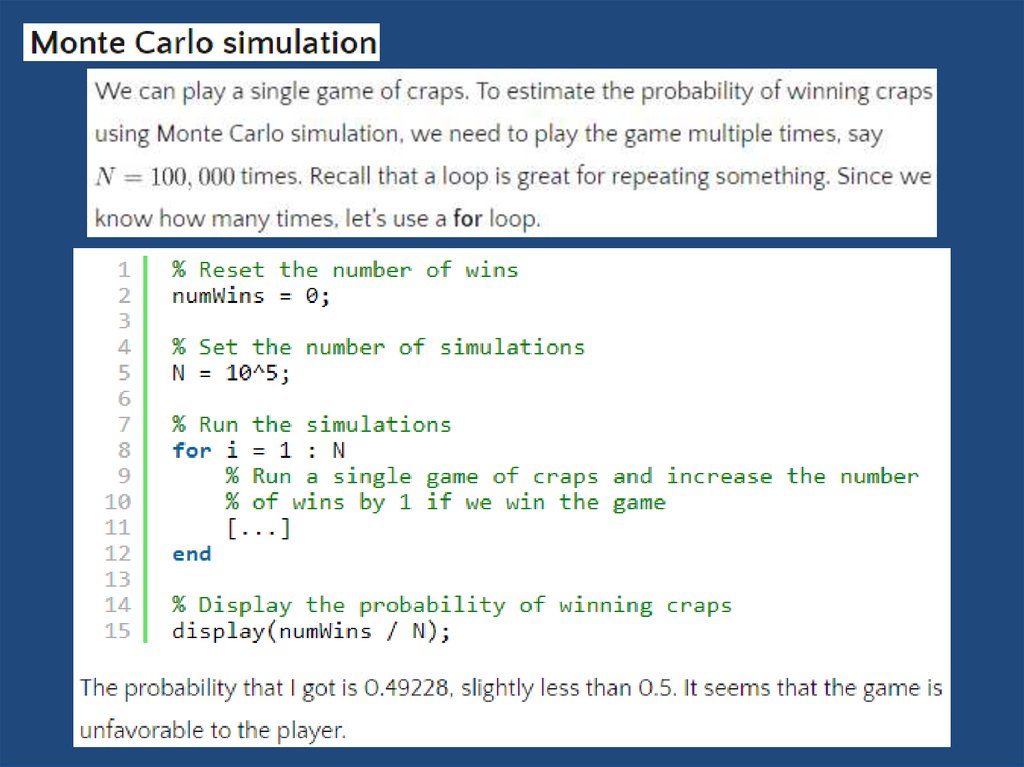
27. Exact
The exact value of probability of win can becalculated by using the theory of Markov Chains
0.4921 P win 0.4937 95% confidence interval
976
P win
0.4929
1980
28. Examples
Example 1:The first example we are going to see is the simulation of a
tossing of a fair coin. First step is analyzing the problem. The
fair coin means that when tossing that coin the probability of
head equal the probability of tail equal 50%. So, using a
digital computer to simulate this phenomenon we are going to
use a uniform Random number generated by the package you
are using or you can write its code.
Uniform random number means that you have a set of random
number between 0 and 1 all with the same probability. But
most languages generate uniform random number integer from
a to b with equal probability.
29. See the following program written in c++
#include <iostream>#include <stdlib.h>
void main(void)
{
int x,nuber_or_trials, head=0, tail=0;
float phead,ptail,error_head,error_tail;
cout<<"enter number of trials"<<endl;
cin>>nuber_or_trials;
for(int i=0;i<nuber_or_trials;i++)
{
x=random(2);
if (x==1) head++;
else ++tail;
}
phead=head*1.0/nuber_or_trials;
ptail=tail*1.0/nuber_or_trials;
error_head = abs(((0.5 - phead)/0.5)*100);
error_tail = abs(((0.5 - ptail)/0.5)*100);
cout<<"probability of head= " <<phead<<" with error ="<<error_head<<"%"<<endl;
cout<<"probability of tai = "<<ptail<<" with error ="<<error_tail<<"%"<<endl;
cin>>x;
}
30. The output results are:
Enter number of trials = 1probability of head= 0 with error =100%
Probability of tail = 1 with error =100%
Enter number of trials =5
probability of head= 0 with error =100%
Probability of tail = 1 with error =100%
Enter number of trials
= 32767
probability of head= 0.496292 with error =0%
Probability of tail = 0.503708 with error =0%
31. Example2 Get the average daily demand for a small grocery store selling a fresh bread according to the following table:
Daily demand DProbability Of
demand P(D)
Device to generate
chance outcomes
Number and color
of balls
100
0.20
20
Red
110
0.50
50
Blue
120
0.30
30
Yellow
Note that:
the proportion of balls of a specific color corresponds exactly to the
probability of a specific level of daily demand.
32.
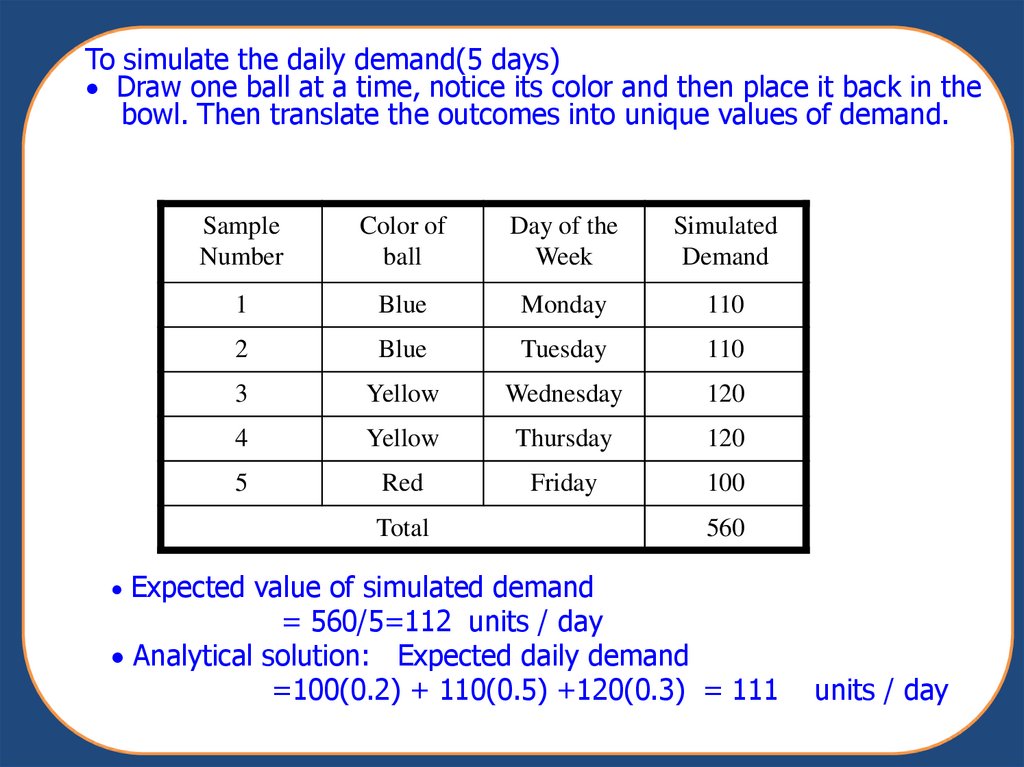
To simulate the daily demand(5 days)Draw one ball at a time, notice its color and then place it back in the
bowl. Then translate the outcomes into unique values of demand.
Sample
Number
Color of
ball
Day of the
Week
Simulated
Demand
1
Blue
Monday
110
2
Blue
Tuesday
110
3
Yellow
Wednesday
120
4
Yellow
Thursday
120
5
Red
Friday
100
Total
560
Expected value of simulated demand
= 560/5=112 units / day
Analytical solution: Expected daily demand
=100(0.2) + 110(0.5) +120(0.3) = 111
units / day