


 Информатика
Похожие презентации:
")


")


Simulation modeling
1.
Simulation modelingThe number of failures of the software when working over the
last 260 hours
The number of failures in 1 hour
Frequency
the number of failures in 1 hour
Using a random number, selected using tables or random number
generators, it is necessary to simulate the occurrence of failures of the
software within 10 hours
2.
Guidelines for solution:Simulation modeling is a tool that allows to build the models describing
processes close to reality. The results will be determined by the random
nature of the process
Simulation is modeled by some random variable.
First, experimental data gives the frequency of occurrence of possible values of
this variable.
Then based on frequencies the probability is calculated => the cumulative
probability.
Knowing the cumulative probability, establish a correspondence between
random numbers and the values of a random variable
3.
The probability of the event is determined by the formulapi – the probability of the i event;
ωi – the frequency of realization of the i event;
N – the total number of events.
Cumulative risk is the sum of all peak probabilities, its value tends to 1.
Depending on how many decimal places will have values of cumulative
probability, we group the random numbers.
4.
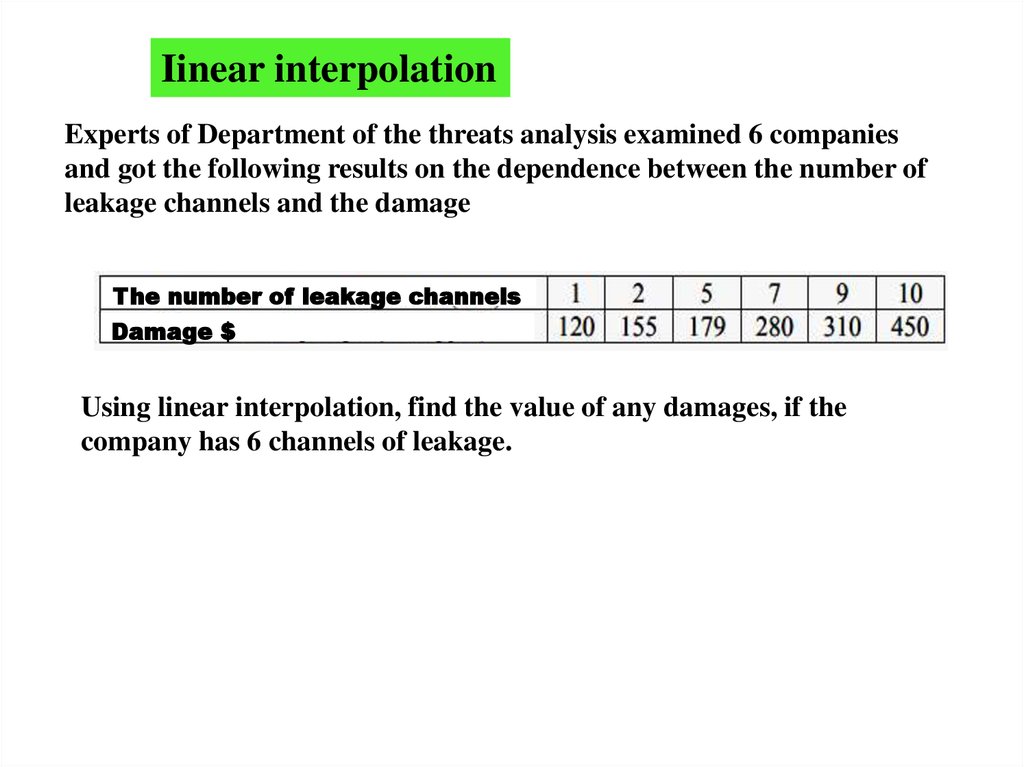
Iinear interpolationExperts of Department of the threats analysis examined 6 companies
and got the following results on the dependence between the number of
leakage channels and the damage
The number of leakage channels
Damage $
Using linear interpolation, find the value of any damages, if the
company has 6 channels of leakage.
5.
Guidelines for solution:Interpolation is a method of finding intermediate values of number
according to the available discrete set of known values.
Linear interpolation is performed on the basis of formula P1(x) = ax + b of the
function f, given in two points x0 and x1 of the interval [a, b]. The formula for
linear interpolation is:
P1(x) - value of the function at the point x;
x - value of the point x;
x0 - value of the start point of the segment;
x1 -value of the end point of the segment;
f(x0) - value of the function at the starting point of the segment;
f(x1) - value of the function at the end point of the segment.
6.
EXPONENTIAL SMOOTHINGThe number of confidential information leakage from the public
authorities of the region for the last 6 months
Month
Number of conf. inf. leakage
For the 1st month a forecast of 13 leaks was given (by information security
professionals). Using a simple exponential smoothing model, give the forecast
on the number of leaks on the 7th month, if the smoothing constant α = 0.8
7.
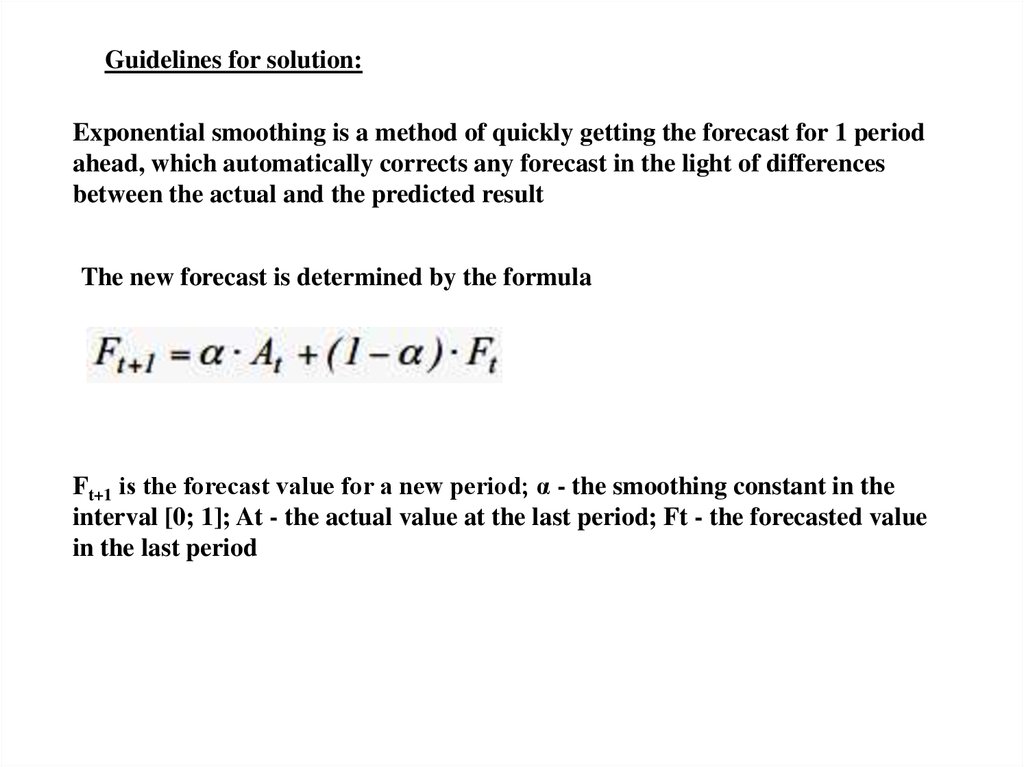
Guidelines for solution:Exponential smoothing is a method of quickly getting the forecast for 1 period
ahead, which automatically corrects any forecast in the light of differences
between the actual and the predicted result
The new forecast is determined by the formula
Ft+1 is the forecast value for a new period; α - the smoothing constant in the
interval [0; 1]; At - the actual value at the last period; Ft - the forecasted value
in the last period
8.
The greater α, the less the influence of the previous years. If the value of α isclose to one, it leads to the taking into account only the latest observations.
n – the number of observations included in the smoothing interval.
Uo (exponentially weighted average initial)
is solved in the following ways:
if there is data on the development of the phenomenon in the past, you can use
the arithmetic average;
if there is no such information, the Uo is equated to the original first value in
base forecast U1.
9.
EVALUATION OF THE FORECAST RELIABILITYYou must provide the CEO report on the reliability of forecasts in the 1
part of the 2014, provided that the information security specialists
predicted the emergence of 25 new types of malicious programs, and as
a result, the monitoring system discovered 33 new species of malicious
program, 22 of them coincided with the experts forecasts.
10.
With the help of Euler circles depict schematically the conditions of theproblem
Nпр = 25, Nнаст = 33, а Nнаст/пр = 22.
11.
Guidelines for solution:1. The degree of reliability of the forecast is characterized by credibility
/reliability and accuracy, as well as the errors of the 1st and 2nd kind.
credibility /reliability
Nнаст/пр – the number of occurred events, which was forecasted;
Nпр – the total number of events, which was forecasted.
12.
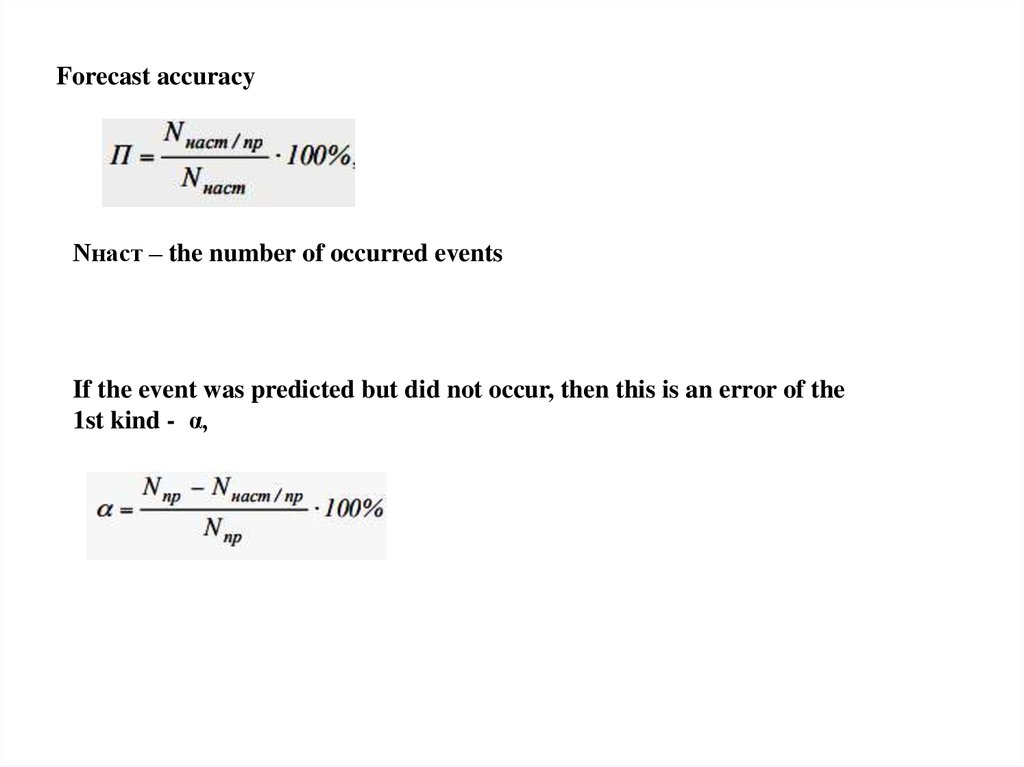
Forecast accuracyNнаст – the number of occurred events
If the event was predicted but did not occur, then this is an error of the
1st kind - α,