


 Медицина
Похожие презентации:


 clinical trial programme in patients with haemophilia A")


Tumors Oncology Clinical Trials
1.
Step-by-Step Guide to Efficacy Analysis in SolidTumors Oncology Clinical Trials
Anastasiia Tiurdo, Intego Group, Kharkiv, Ukraine
Frankfurt 2018
2.
IntroductionCancer is no longer a death sentence!
3.
IntroductionRECIST Criteria Features
Widely accepted and readily applied
Subject of interest – assessment of a
change in the tumor burden
Covers the whole analysis process:
data collection efficacy conclusion
Required for all the clinical trials where
ORR or PFS are study endpoints
RECIST 1.1 currently in use
European Organization Research and
Treatment for Cancer (EORTC) and others,
2000 (V1.0) and 2009 (V1.1)
Page 3
4.
Baseline TumorDocumentation
5.
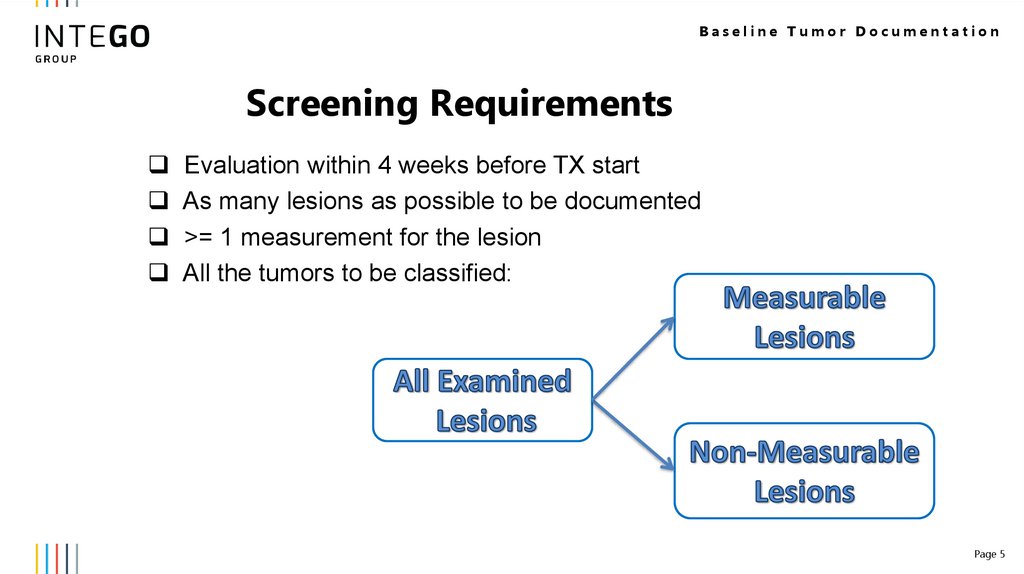
Baseline Tumor DocumentationScreening Requirements
Evaluation within 4 weeks before TX start
As many lesions as possible to be documented
>= 1 measurement for the lesion
All the tumors to be classified:
Page 5
6.
Baseline Tumor DocumentationStudy Eligibility
is required if ORR is a primary efficacy endpoint
(typical for Phase II studies)
can be accepted if Time to Progression
is a primary efficacy endpoint (typical for Phase III studies).
Progression Disease Definition to be clarified!
Page 6
7.
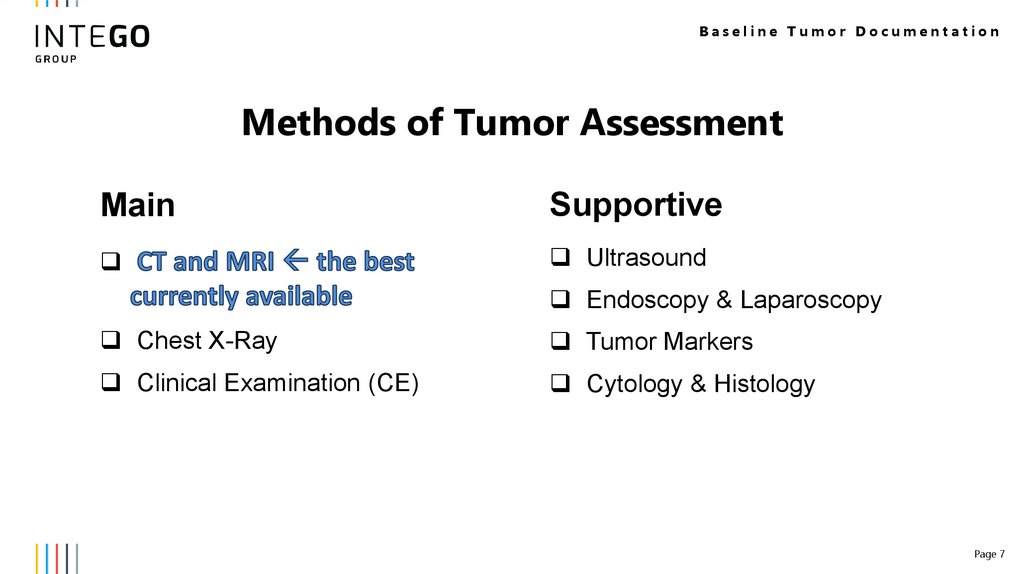
Baseline Tumor DocumentationMethods of Tumor Assessment
Main
Supportive
Ultrasound
Endoscopy & Laparoscopy
Chest X-Ray
Tumor Markers
Clinical Examination (CE)
Cytology & Histology
Page 7
8.
Baseline Tumor DocumentationMethods of Tumor Assessment
The same technique to be
used to one lesion at
baseline and during the
follow-up!
Page 8
9.
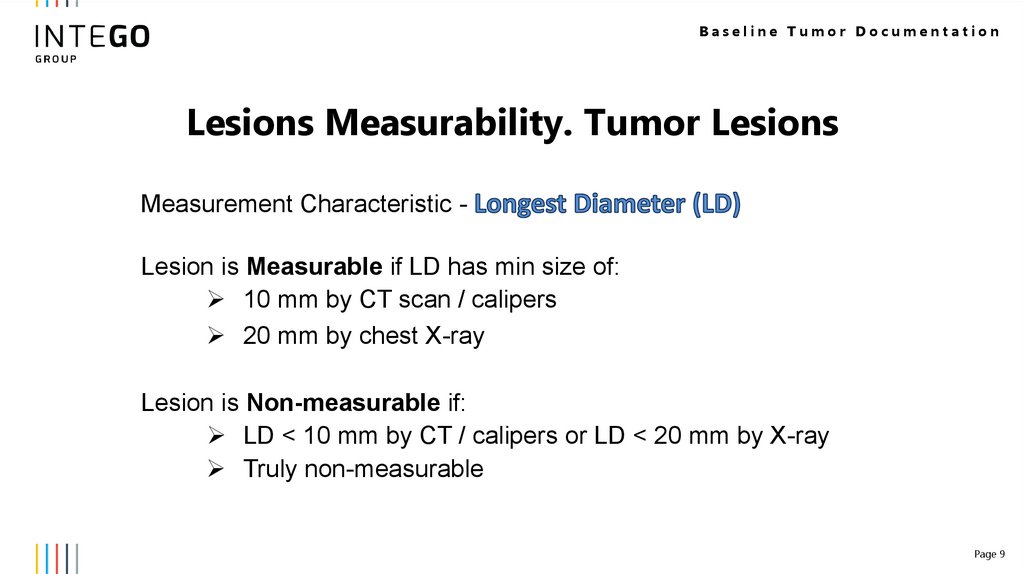
Baseline Tumor DocumentationLesions Measurability. Tumor Lesions
Measurement Characteristic Lesion is Measurable if LD has min size of:
10 mm by CT scan / calipers
20 mm by chest X-ray
Lesion is Non-measurable if:
LD < 10 mm by CT / calipers or LD < 20 mm by X-ray
Truly non-measurable
Page 9
10.
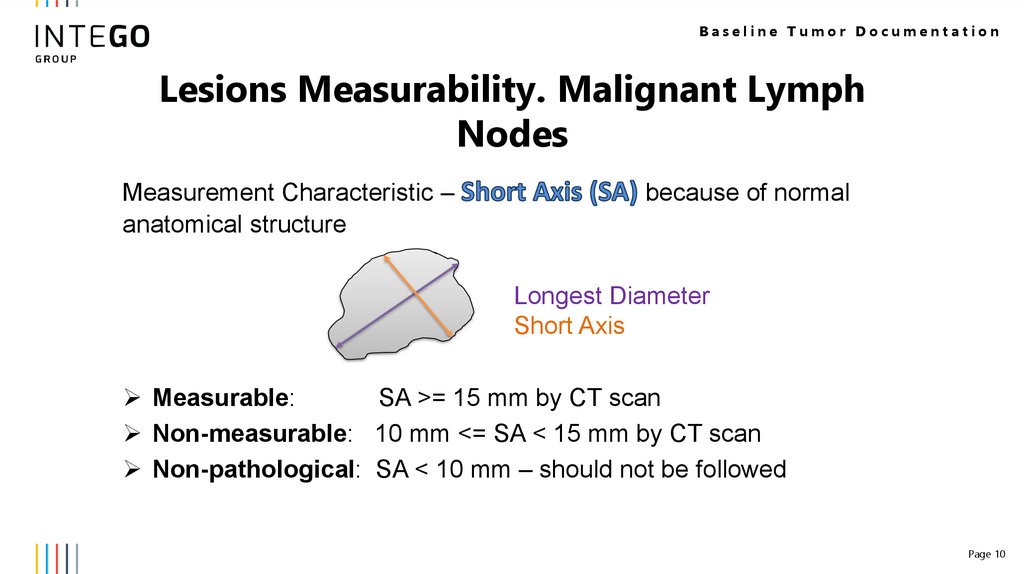
Baseline Tumor DocumentationLesions Measurability. Malignant Lymph
Nodes
Measurement Characteristic –
anatomical structure
because of normal
Longest Diameter
Short Axis
Measurable:
SA >= 15 mm by CT scan
Non-measurable: 10 mm <= SA < 15 mm by CT scan
Non-pathological: SA < 10 mm – should not be followed
Page 10
11.
Baseline Tumor DocumentationTumor Categorization
Two separate tumor groups:
and
Different follow-up approaches
Valid until the end of the study
Page 11
12.
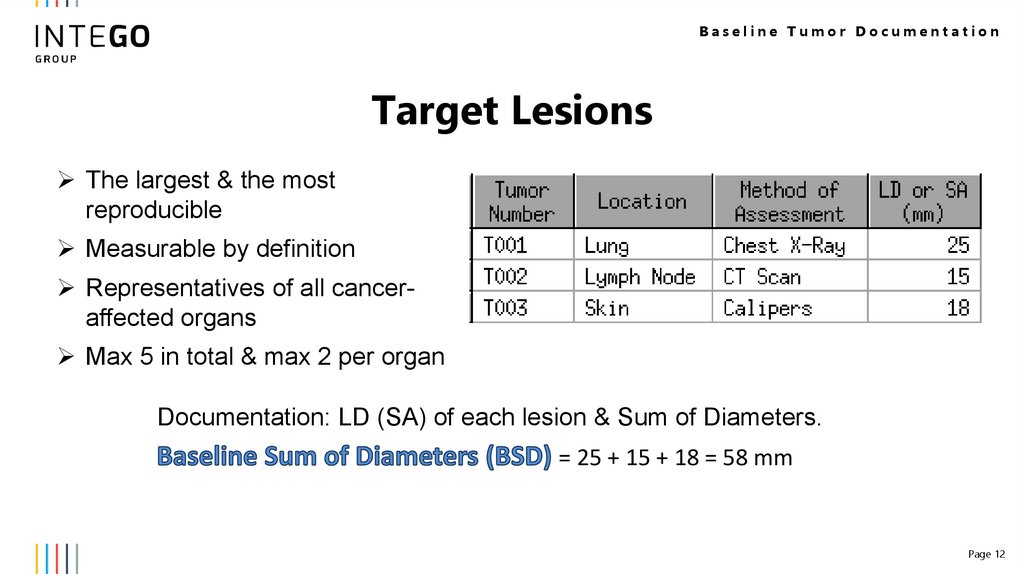
Baseline Tumor DocumentationTarget Lesions
The largest & the most
reproducible
Measurable by definition
Representatives of all canceraffected organs
Max 5 in total & max 2 per organ
Documentation: LD (SA) of each lesion & Sum of Diameters.
= 25 + 15 + 18 = 58 mm
Page 12
13.
Baseline Tumor DocumentationNon-Target Lesions
All lesions excluded from the target
Not required to be measurable
Number is not limited
Multiple lesions in the same organ in one item - Okay
Documentation: the fact of the presence is enough!
Page 13
14.
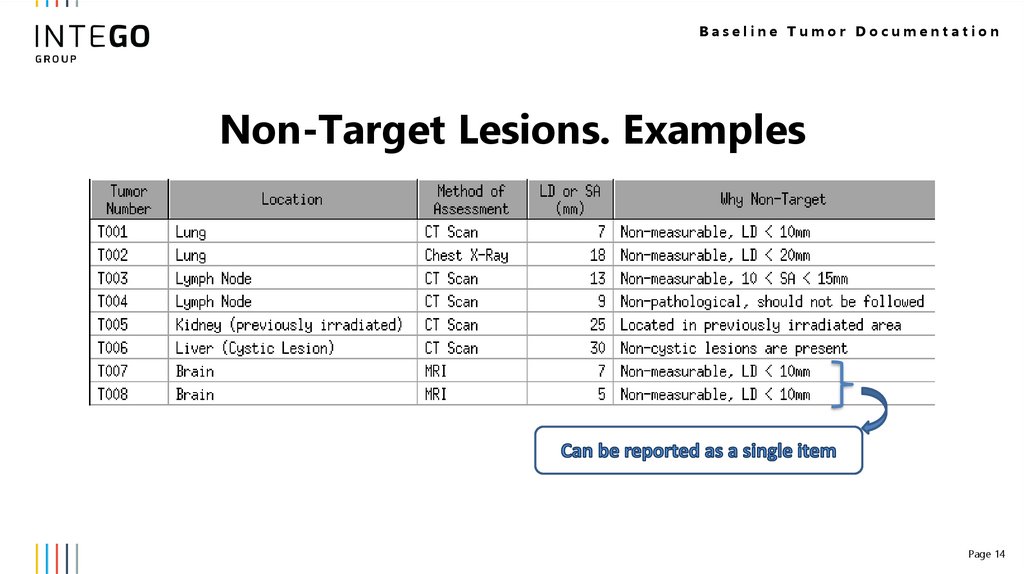
Baseline Tumor DocumentationNon-Target Lesions. Examples
Page 14
15.
Post-Baseline TumorEvaluation
16.
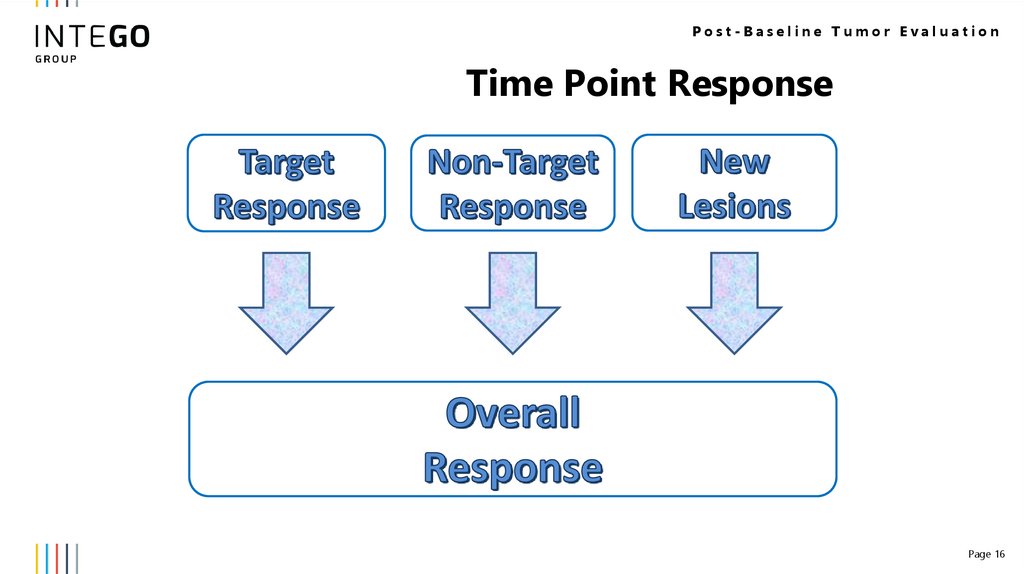
Post-Baseline Tumor EvaluationTime Point Response
Page 16
17.
Post-Baseline Tumor EvaluationFrequency of the tumor assessments
Based on the treatment schedule
and study phase
Independent of a study drug delay &
omission & interruption
Tumor evaluation after the TX end?
Depends on the study primary
endpoints
Page 17
18.
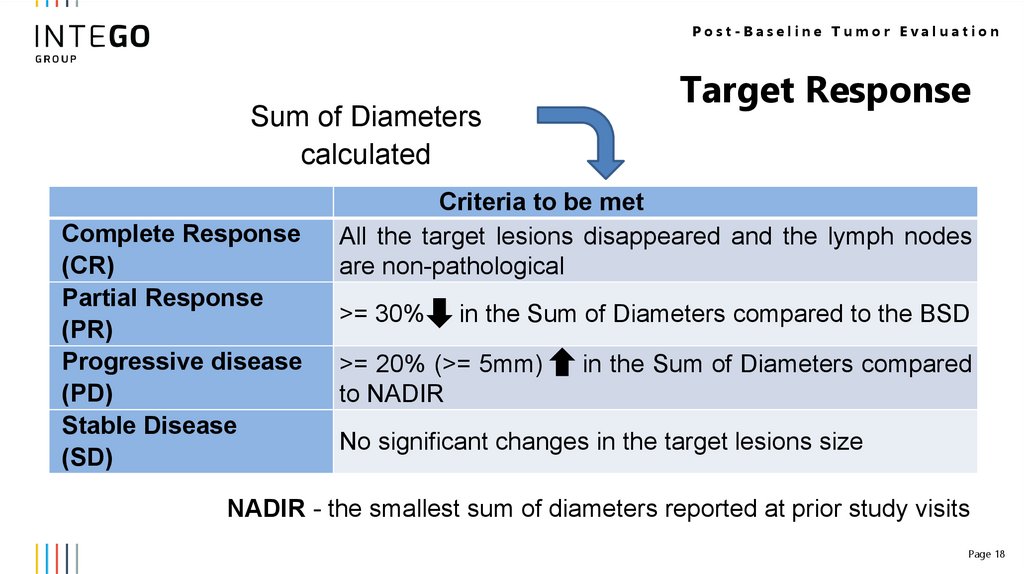
Post-Baseline Tumor EvaluationSum of Diameters
calculated
Complete Response
(CR)
Partial Response
(PR)
Progressive disease
(PD)
Stable Disease
(SD)
Target Response
Criteria to be met
All the target lesions disappeared and the lymph nodes
are non-pathological
>= 30%
in the Sum of Diameters compared to the BSD
>= 20% (>= 5mm)
to NADIR
in the Sum of Diameters compared
No significant changes in the target lesions size
NADIR - the smallest sum of diameters reported at prior study visits
Page 18
19.
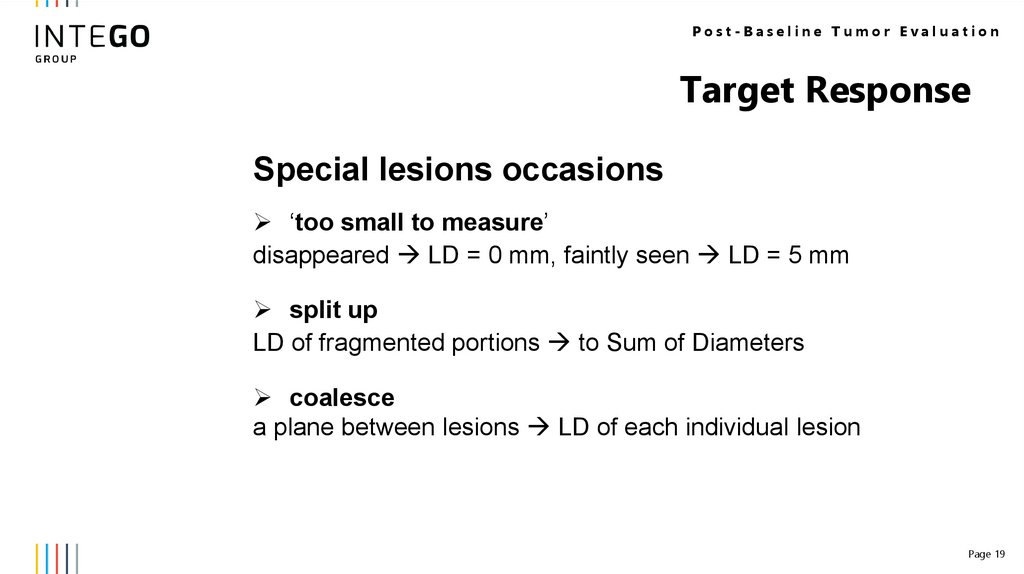
Post-Baseline Tumor EvaluationTarget Response
Special lesions occasions
‘too small to measure’
disappeared LD = 0 mm, faintly seen LD = 5 mm
split up
LD of fragmented portions to Sum of Diameters
coalesce
a plane between lesions LD of each individual lesion
Page 19
20.
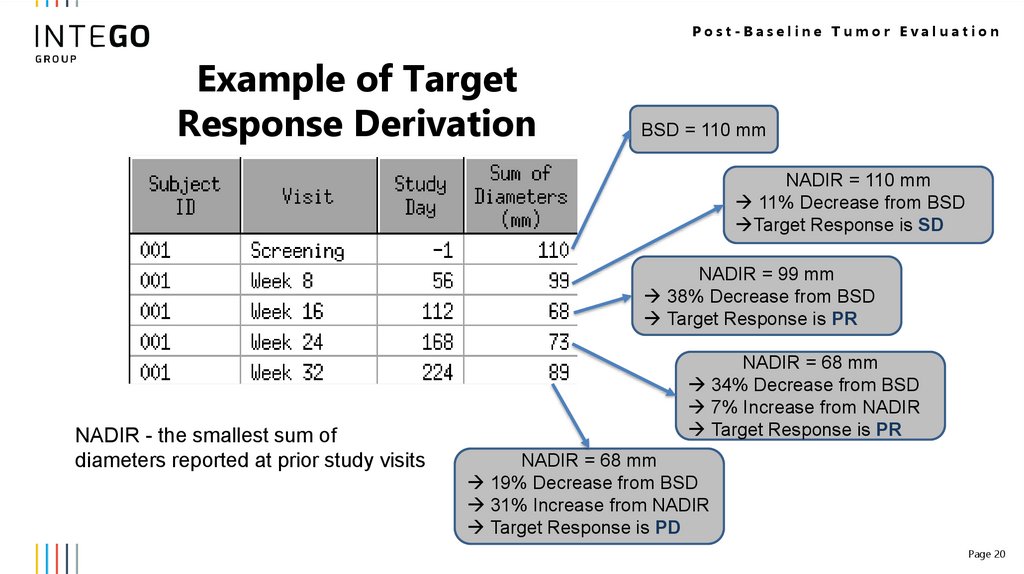
Post-Baseline Tumor EvaluationExample of Target
Response Derivation
BSD = 110 mm
NADIR = 110 mm
11% Decrease from BSD
Target Response is SD
NADIR = 99 mm
38% Decrease from BSD
Target Response is PR
NADIR - the smallest sum of
diameters reported at prior study visits
NADIR = 68 mm
34% Decrease from BSD
7% Increase from NADIR
Target Response is PR
NADIR = 68 mm
19% Decrease from BSD
31% Increase from NADIR
Target Response is PD
Page 20
21.
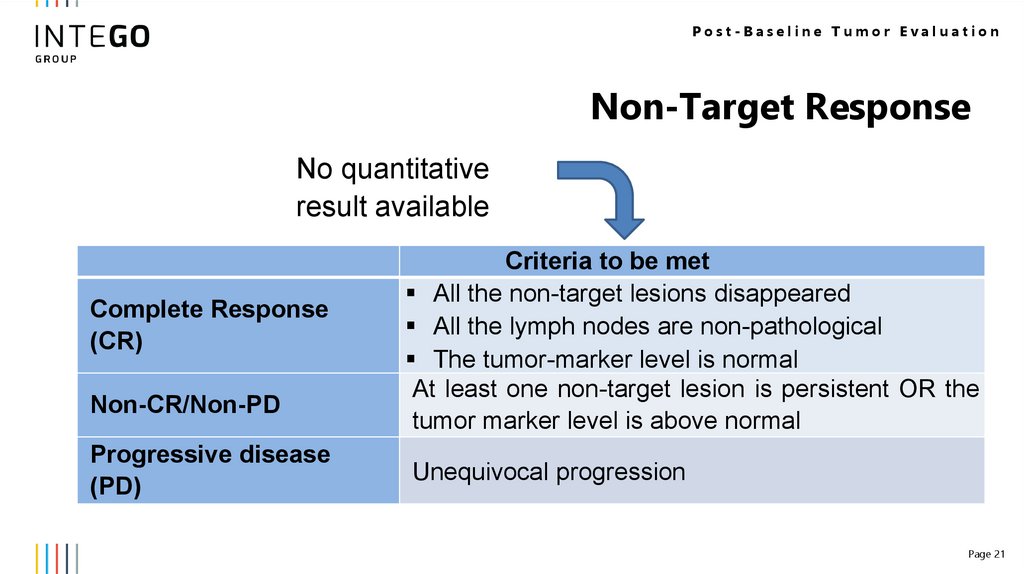
Post-Baseline Tumor EvaluationNon-Target Response
No quantitative
result available
Complete Response
(CR)
Non-CR/Non-PD
Progressive disease
(PD)
Criteria to be met
All the non-target lesions disappeared
All the lymph nodes are non-pathological
The tumor-marker level is normal
At least one non-target lesion is persistent OR the
tumor marker level is above normal
Unequivocal progression
Page 21
22.
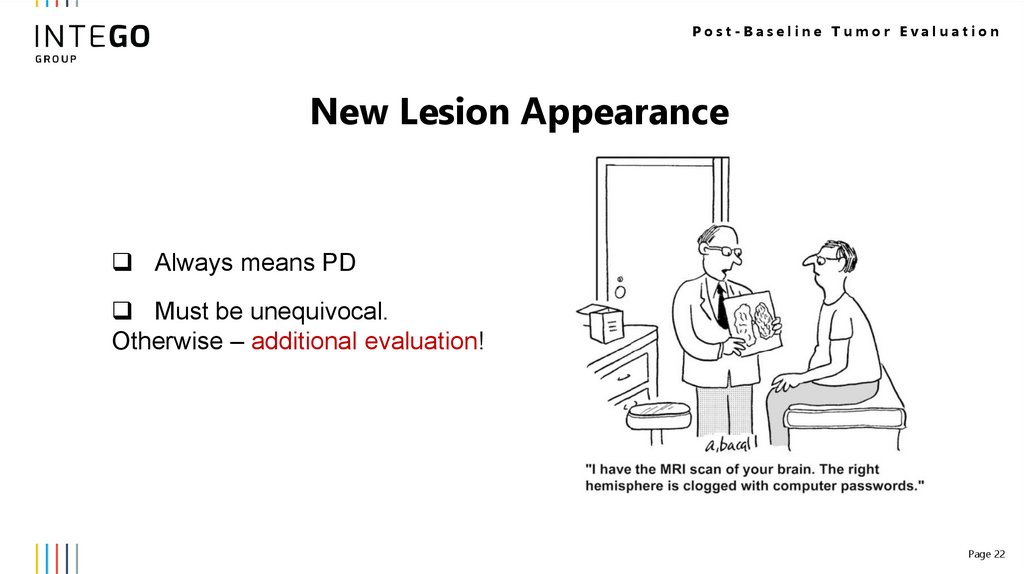
Post-Baseline Tumor EvaluationNew Lesion Appearance
Always means PD
Must be unequivocal.
Otherwise – additional evaluation!
Page 22
23.
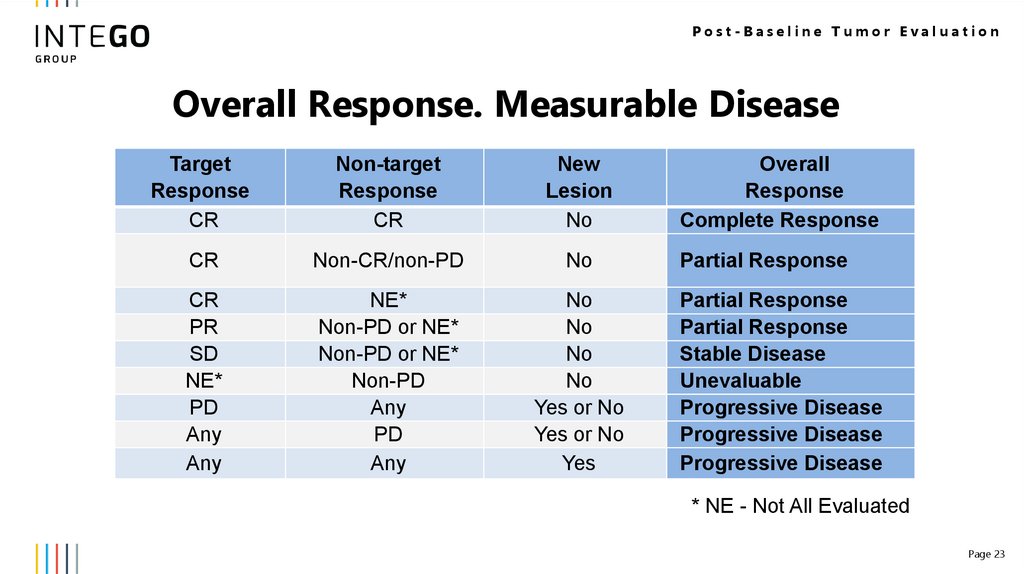
Post-Baseline Tumor EvaluationOverall Response. Measurable Disease
Target
Response
CR
Non-target
Response
CR
New
Lesion
No
CR
Non-CR/non-PD
No
CR
PR
SD
NE*
PD
Any
Any
NE*
Non-PD or NE*
Non-PD or NE*
Non-PD
Any
PD
Any
No
No
No
No
Yes or No
Yes or No
Yes
Overall
Response
Complete Response
Partial Response
Partial Response
Partial Response
Stable Disease
Unevaluable
Progressive Disease
Progressive Disease
Progressive Disease
* NE - Not All Evaluated
Page 23
24.
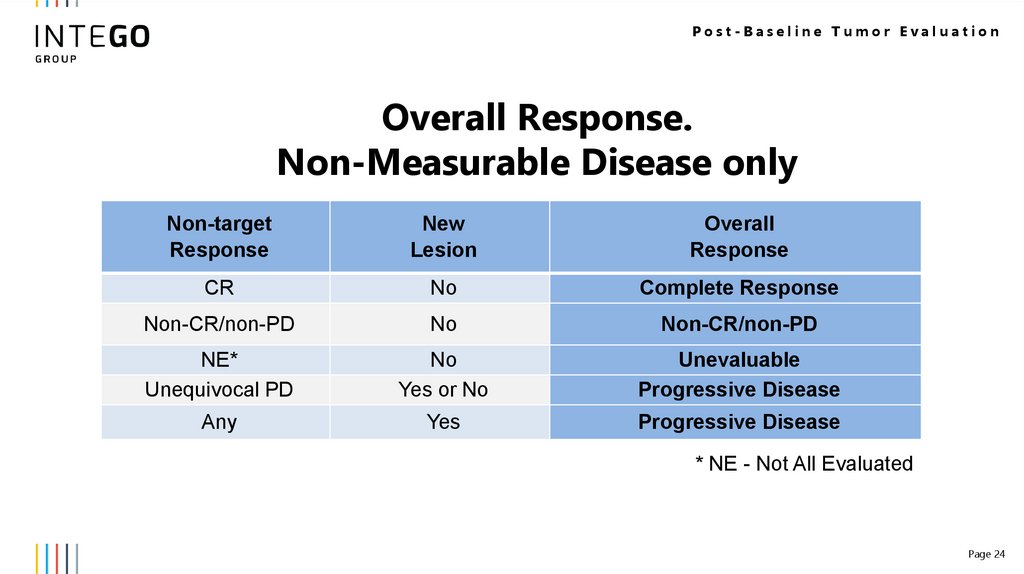
Post-Baseline Tumor EvaluationOverall Response.
Non-Measurable Disease only
Non-target
Response
New
Lesion
Overall
Response
CR
No
Complete Response
Non-CR/non-PD
No
Non-CR/non-PD
NE*
Unequivocal PD
No
Yes or No
Unevaluable
Progressive Disease
Any
Yes
Progressive Disease
* NE - Not All Evaluated
Page 24
25.
Best Overall Response26.
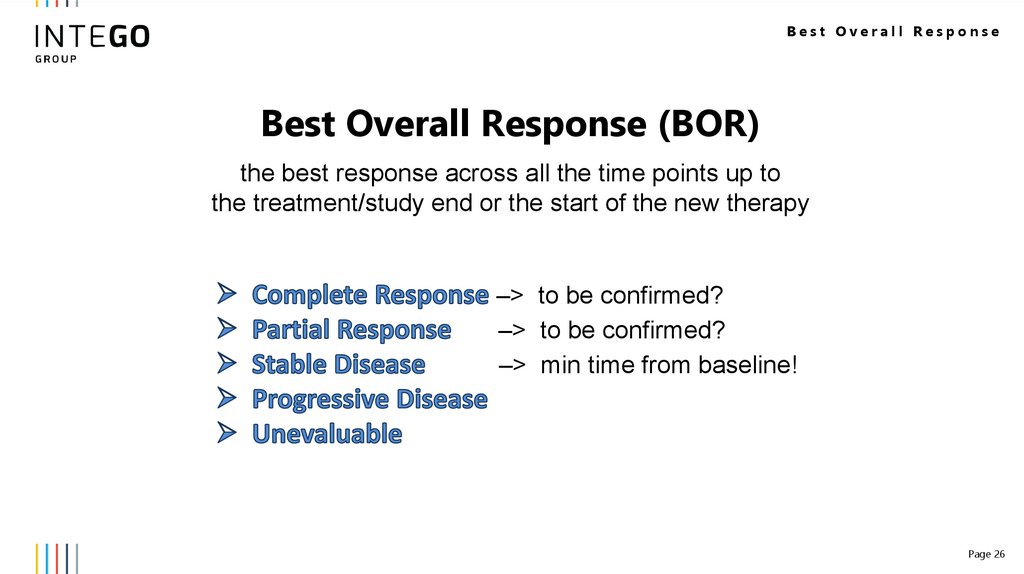
Best Overall ResponseBest Overall Response (BOR)
the best response across all the time points up to
the treatment/study end or the start of the new therapy
–> to be confirmed?
–> to be confirmed?
–> min time from baseline!
Page 26
27.
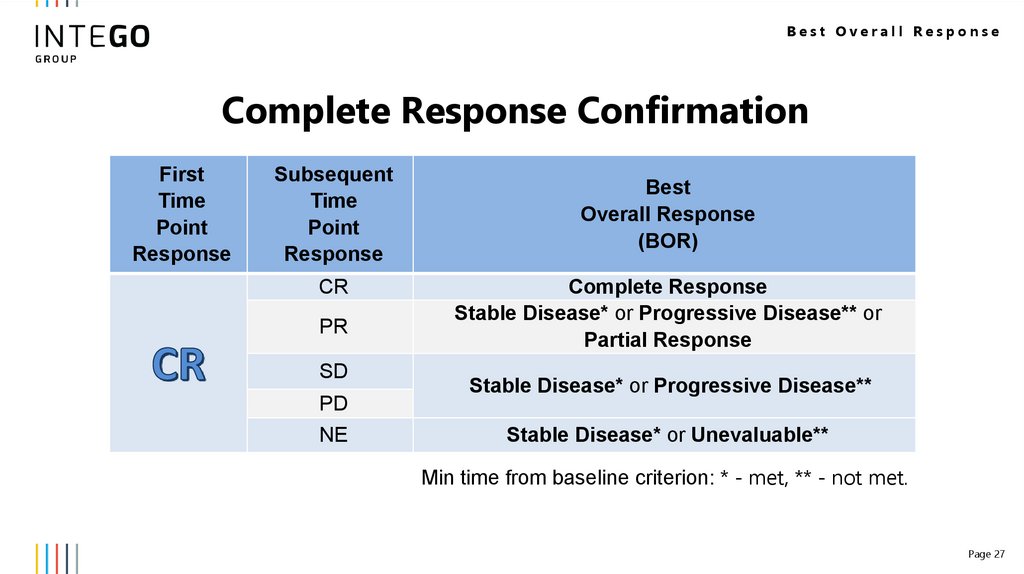
Best Overall ResponseComplete Response Confirmation
First
Time
Point
Response
Subsequent
Time
Point
Response
CR
PR
SD
PD
NE
Best
Overall Response
(BOR)
Complete Response
Stable Disease* or Progressive Disease** or
Partial Response
Stable Disease* or Progressive Disease**
Stable Disease* or Unevaluable**
Min time from baseline criterion: * - met, ** - not met.
Page 27
28.
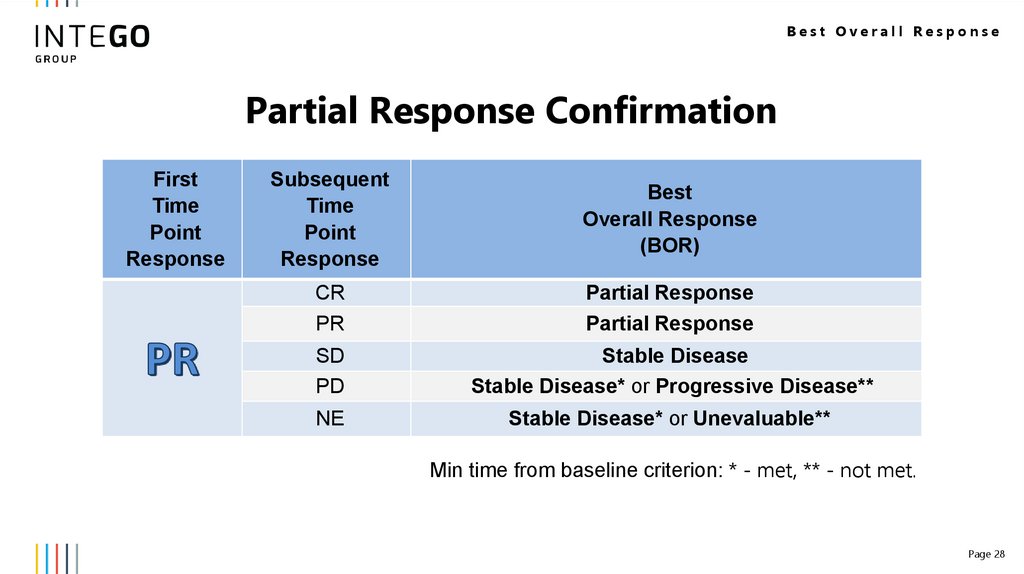
Best Overall ResponsePartial Response Confirmation
First
Time
Point
Response
Subsequent
Time
Point
Response
Best
Overall Response
(BOR)
CR
PR
Partial Response
Partial Response
SD
PD
Stable Disease
Stable Disease* or Progressive Disease**
NE
Stable Disease* or Unevaluable**
Min time from baseline criterion: * - met, ** - not met.
Page 28
29.
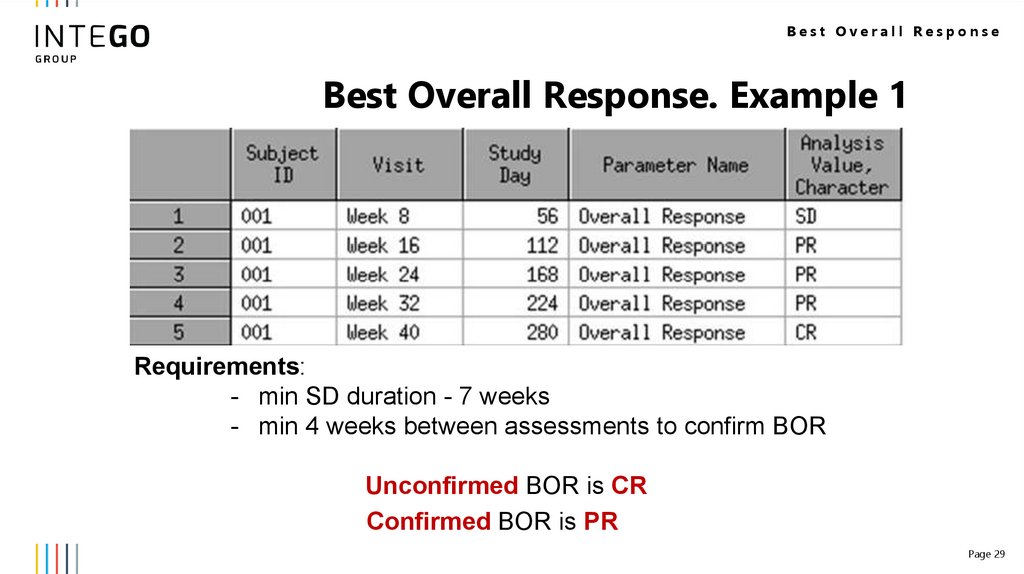
Best Overall ResponseBest Overall Response. Example 1
Requirements:
- min SD duration - 7 weeks
- min 4 weeks between assessments to confirm BOR
Unconfirmed BOR is CR
Confirmed BOR is PR
Page 29
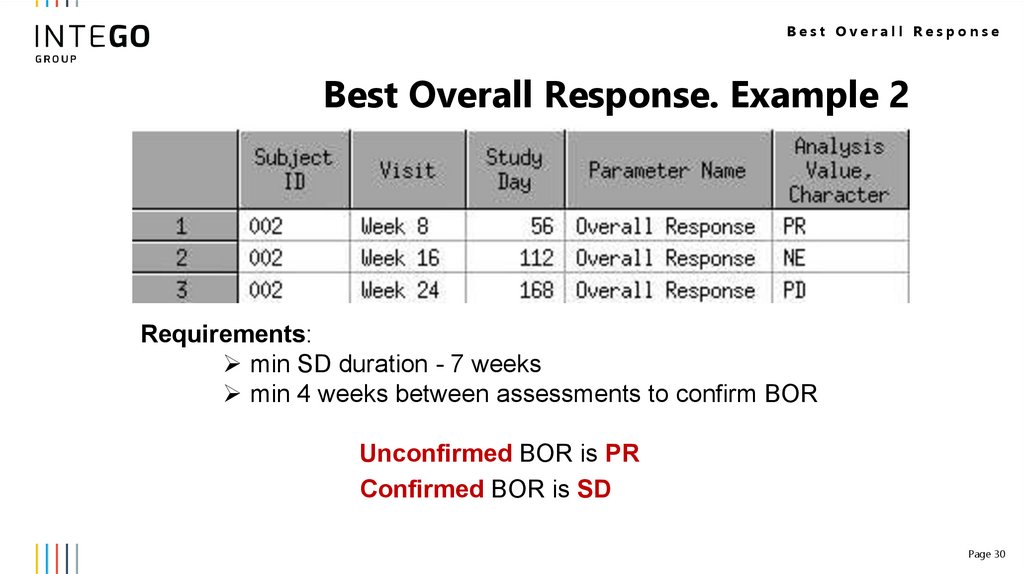
30.
Best Overall ResponseBest Overall Response. Example 2
Requirements:
min SD duration - 7 weeks
min 4 weeks between assessments to confirm BOR
Unconfirmed BOR is PR
Confirmed BOR is SD
Page 30
31.
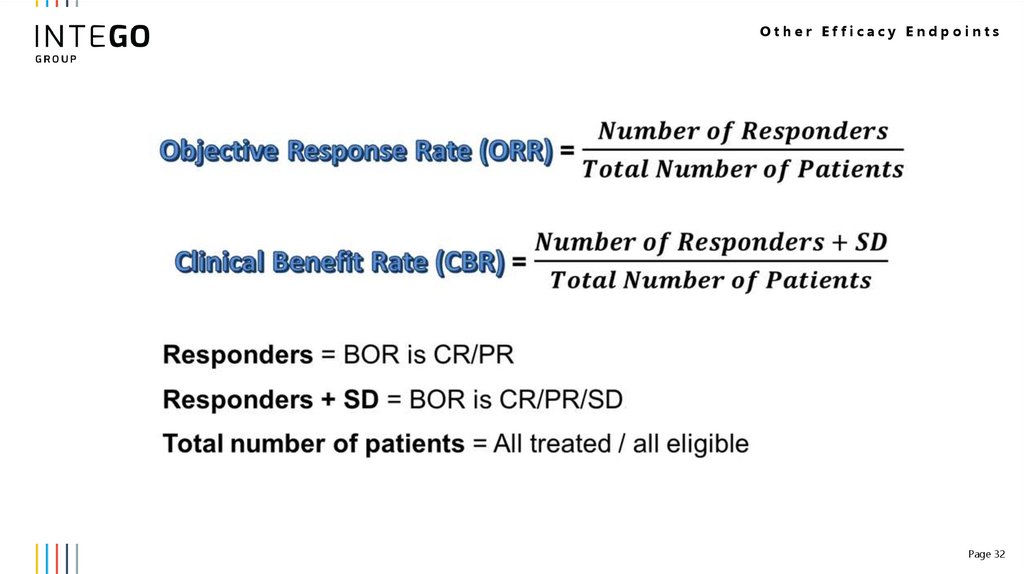
Other Efficacy Endpoints32.
Other Efficacy EndpointsPage 32
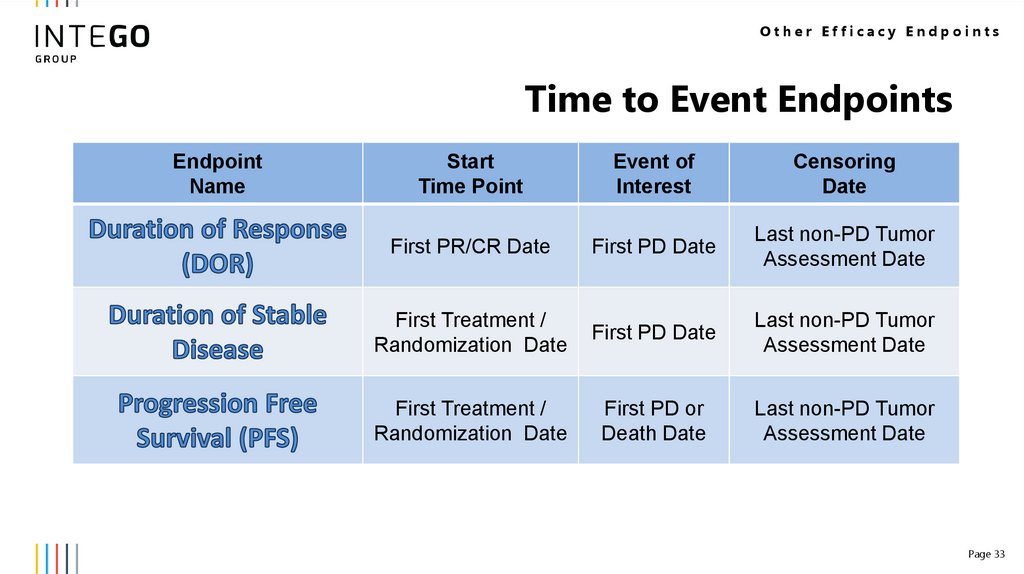
33.
Other Efficacy EndpointsTime to Event Endpoints
Endpoint
Name
Start
Time Point
Event of
Interest
Censoring
Date
First PR/CR Date
First PD Date
Last non-PD Tumor
Assessment Date
First Treatment /
Randomization Date
First PD Date
Last non-PD Tumor
Assessment Date
First Treatment /
Randomization Date
First PD or
Death Date
Last non-PD Tumor
Assessment Date
Page 33
34.
Conclusion35.
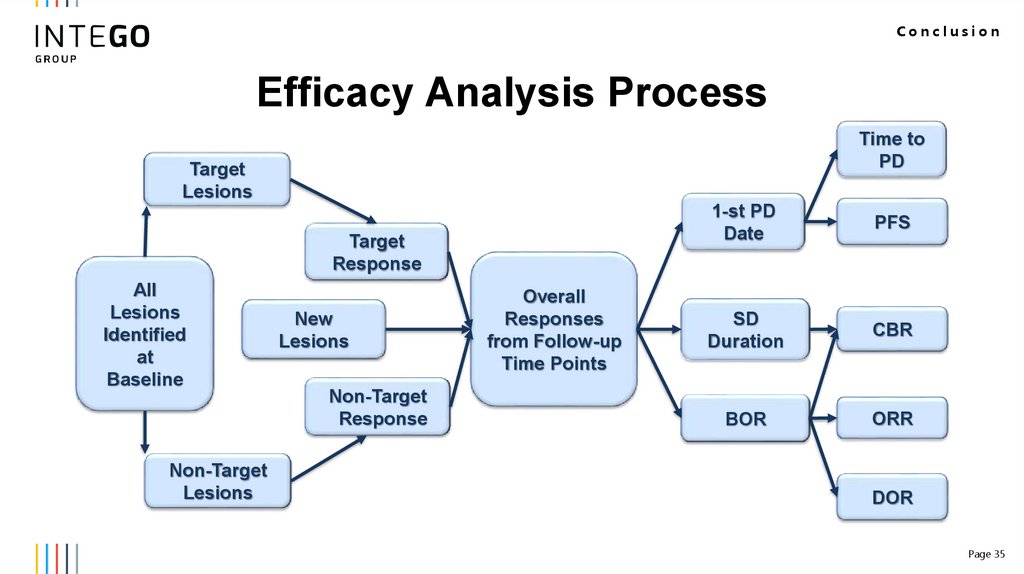
ConclusionEfficacy Analysis Process
Time to
PD
Target
Lesions
Target
Response
All
Lesions
Identified
at
Baseline
Non-Target
Lesions
New
Lesions
Non-Target
Response
Overall
Responses
from Follow-up
Time Points
1-st PD
Date
PFS
SD
Duration
CBR
BOR
ORR
DOR
Page 35
36.
THANK YOUAnastasiia Tiurdo
anastasiia.tiurdo@intego-group.com,
Kharkiv, Ukraine
www.intego-group.com