


 Физика
Похожие презентации:

")


")
Lecture 7. Correlation and Regression
1.
2.
LECTURE 8Correlation and Regression
Temur Makhkamov
Indira Khadjieva
QM Module Leaders
tmakhkamov@wiut.uz
i.khadjieva@wiut.uz
Office hours: by appointment
Room IB 205
EXT: 546
3.
Lecture outlineDefine and calculate correlation coefficient
Find the regression line and use it for regression analysis
Define and calculate coefficient of determination (R-squared)
4.
CORRELATIONCorrelation is a measure of the strength of a linear relationship
between two quantitative variables
SIMPLY, it's how two variables move in relation to one another.
Measures the relationship, or association, between two variables
by looking at how the variables change with respect to each other
The correlation coefficient is a value that indicates the strength of
the relationship between variables. The coefficient can take any
values from -1 to 1.
5.
6.
Doing exersice & BMI (Body Mas Index)7.
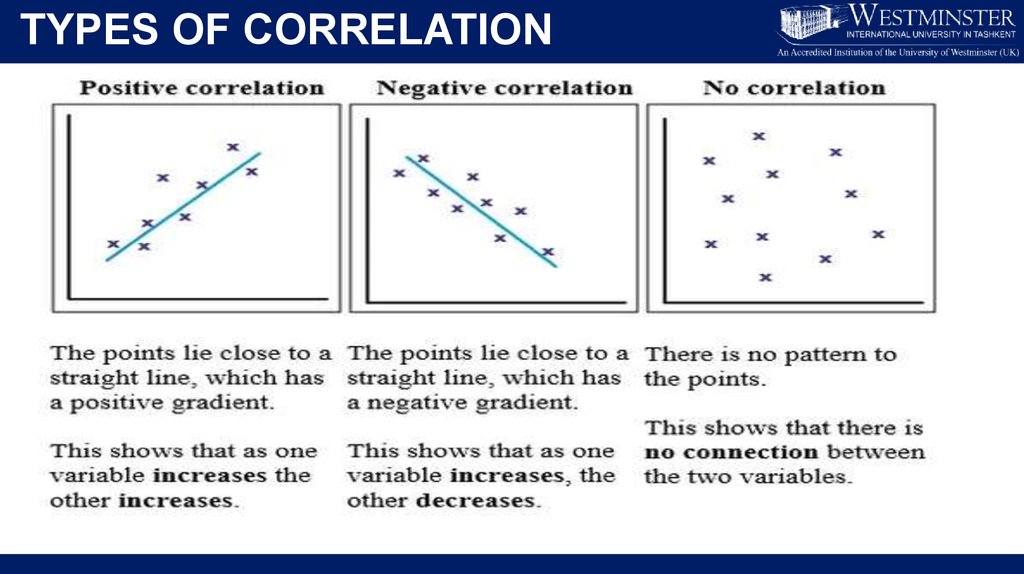
TYPES OF CORRELATION8.
POSITIVE CORRELATION EXAMPLESAs the number of trees cut down increases, the probability of erosion
increases.
As you eat more antioxidants, your immune system improves.
The more time you spend running on a treadmill, the more calories you will
burn.
The longer your hair grows, the more shampoo you will need.
The more money YOU save, the more financially secure YOU feel.
As you drink more coffee, the number of hours you stay awake increases.
As a child grows, so does his clothing size.
The more you exercise your muscles, the stronger YOU get
9.
Negative Correlation ExamplesA student who has many absences has a decrease in grades.
If the sun shines more, a house with solar panels requires less use of other
electricity.
The older a man gets, the less hair that he has.
The more one cleans the house, the less likely there are to be pest
problems.
The more one smokes cigarettes, the fewer years he will have to live.
The more one runs, the less likely one is to have cardiovascular problems.
The more vitamins one takes, the less likely one is to have a deficiency.
The more iron an anemic person consumes, the less tired one may be.
10.
CORRELATION COEFFICIENT11.
Measuring association between the variables12.
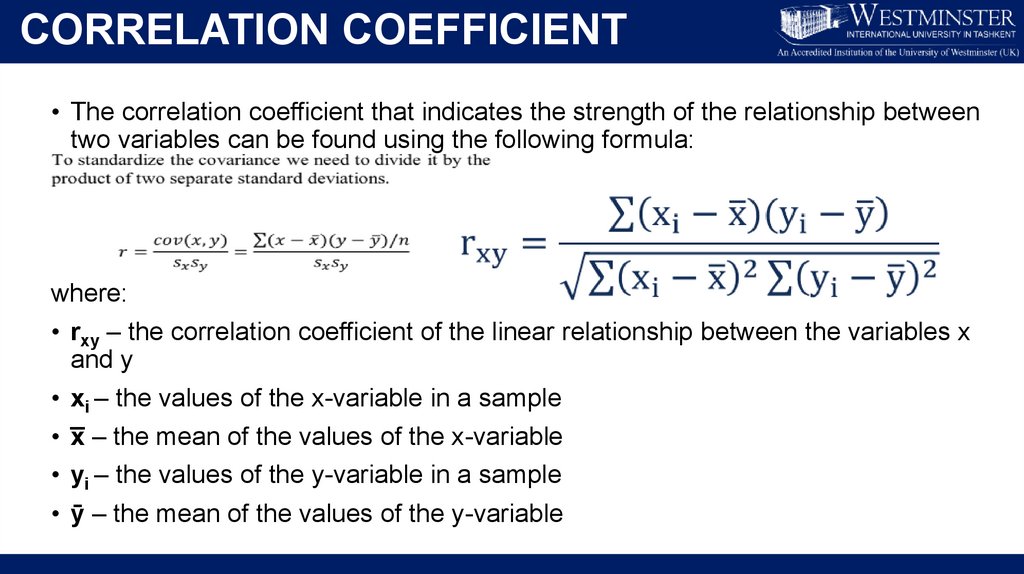
CORRELATION COEFFICIENT• The correlation coefficient that indicates the strength of the relationship between
two variables can be found using the following formula:
where:
• rxy – the correlation coefficient of the linear relationship between the variables x
and y
xi – the values of the x-variable in a sample
x̅ – the mean of the values of the x-variable
yi – the values of the y-variable in a sample
• ȳ – the mean of the values of the y-variable
13.
Finding CorrelationJake is an investor. His portfolio primarily tracks the performance of the S&P 500
and he wants to add a stock of Apple Inc. Before adding Apple to his portfolio, he
wants to assess the correlation between the stock and the S&P 500 to ensure
that adding the stock won’t increase the systematic risk of his portfolio.
S&P 500
2017
2018
2019
2020
2021
Apple
2275
2743
2531
2541
3756
29,48
39,1
38,07
79,58
127,14
14.
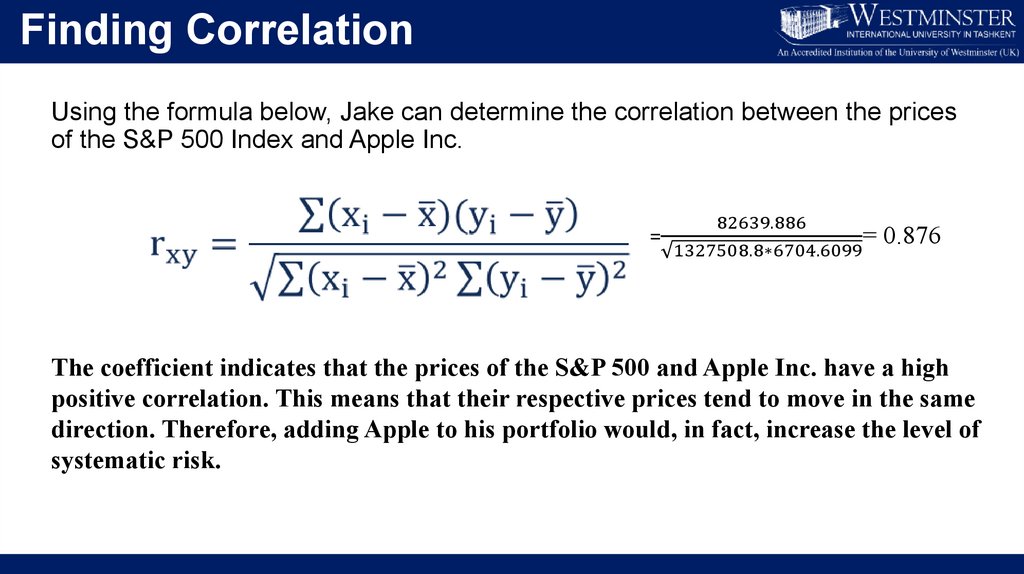
Finding CorrelationUsing the formula below, Jake can determine the correlation between the prices
of the S&P 500 Index and Apple Inc.
82639.886
=
=
1327508.8∗6704.6099
0.876
The coefficient indicates that the prices of the S&P 500 and Apple Inc. have a high
positive correlation. This means that their respective prices tend to move in the same
direction. Therefore, adding Apple to his portfolio would, in fact, increase the level of
systematic risk.
15.
CalculationS&P 500 (x) Apple (y) x-xmean (a) y-ymean (b) a*b
(x-xmean)^2 (y-ymean)^2
2017
2275
29,48
-494,2 -33,194 16404,4748 244233,64 1101,84164
2018
2743
39,1
-26,2 -23,574 617,6388
686,44 555,733476
2019
2531
38,07
-238,2 -24,604 5860,6728 56739,24 605,356816
2020
2541
79,58
-228,2
16,906 -3857,9492 52075,24 285,812836
2021
3756
127,14
986,8
64,466 63615,0488 973774,24 4155,86516
Total
13846
313,37
82639,886 1327508,8 6704,60992
16.
Mesuring association between variables17.
Strengths of CorrelationCorrelation allows the researcher to investigate naturally occurring
variables that maybe unethical or impractical to test experimentally. For
example, it would be unethical to conduct an experiment on whether
smoking causes lung cancer.
Correlation allows the researcher to clearly and easily see if there is a
relationship between variables. This can then be displayed in a graphical
form.
18.
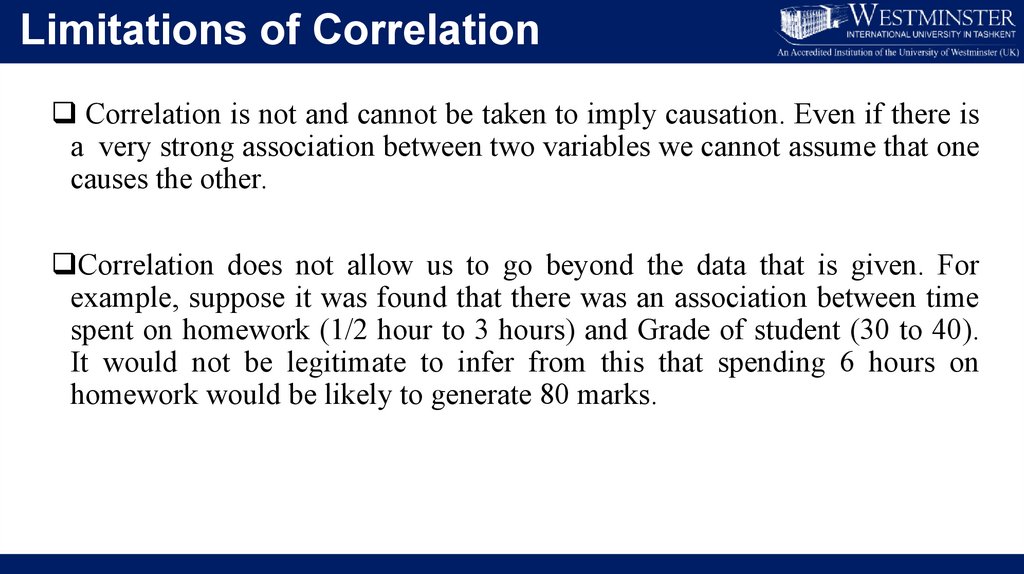
Limitations of CorrelationCorrelation is not and cannot be taken to imply causation. Even if there is
a very strong association between two variables we cannot assume that one
causes the other.
Correlation does not allow us to go beyond the data that is given. For
example, suppose it was found that there was an association between time
spent on homework (1/2 hour to 3 hours) and Grade of student (30 to 40).
It would not be legitimate to infer from this that spending 6 hours on
homework would be likely to generate 80 marks.
19.
RegressionIf the relationship between variables exists (as we can see from correlation
coefficient) we would be interested in predicting the behaviour of one
variable, say y, from behaviour of the other, say x
Regression analysis is a well-known statistical learning technique useful to
infer the relationship between a dependent variable Y and independent
variables.
- predictor, explanatory or independent variable denoted x ;
- dependent variable, response, or outcome denoted by y.
20.
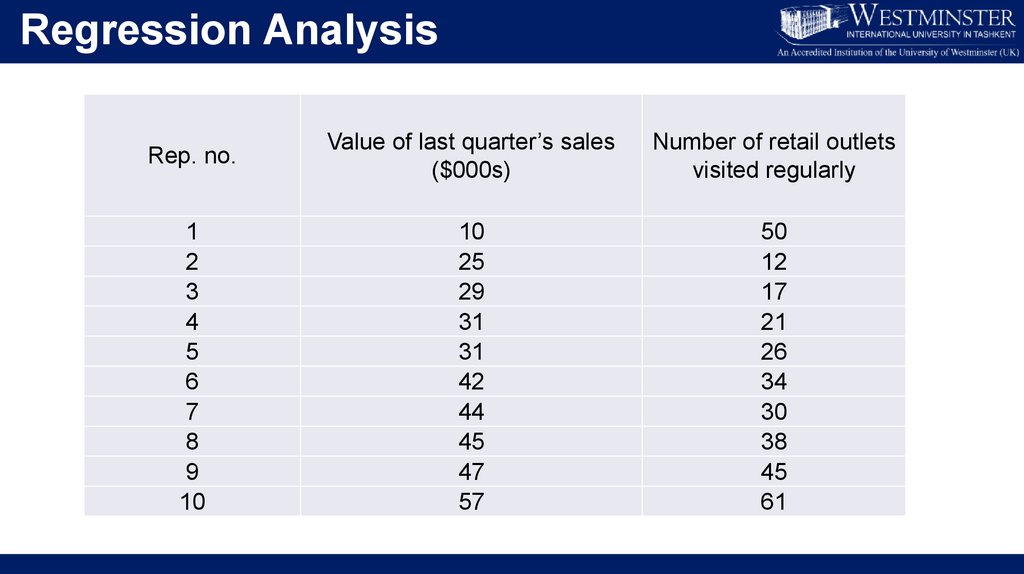
Regression AnalysisRep. no.
Value of last quarter’s sales
($000s)
Number of retail outlets
visited regularly
1
2
3
4
5
6
7
8
9
10
10
25
29
31
31
42
44
45
47
57
50
12
17
21
26
34
30
38
45
61
21.
Regression AnalysisRelationship between the sales and number of outlets visited could be well
approximated by the line :
Sales=a+ b *number of outlets visited (where a is a number of sales when no
outlet is visited (x=0)
Scatter graph showing positive correlation
Or y=a+bx
Sales value ($ 000's)
60
50
40
30
20
10
0
0
10
20
30
40
#of outlets visited
50
60
70
22.
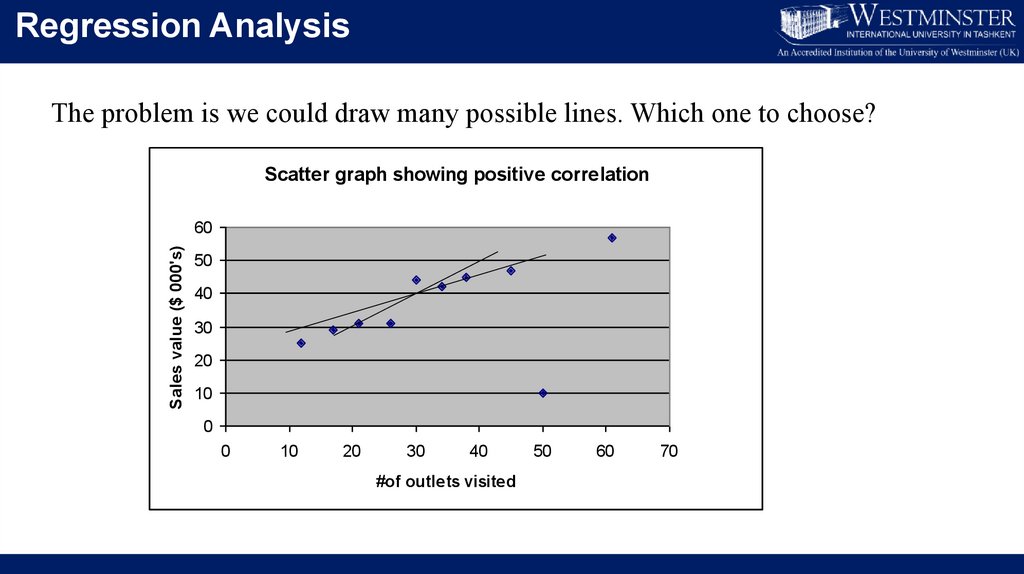
Regression AnalysisThe problem is we could draw many possible lines. Which one to choose?
Scatter graph showing positive correlation
Sales value ($ 000's)
60
50
40
30
20
10
0
0
10
20
30
40
#of outlets visited
50
60
70
23.
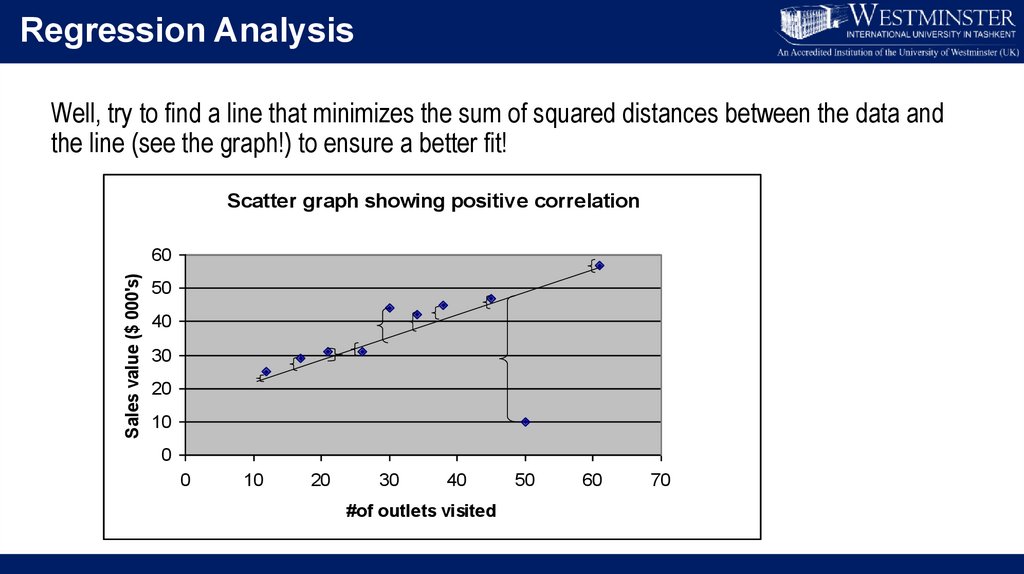
Regression AnalysisWell, try to find a line that minimizes the sum of squared distances between the data and
the line (see the graph!) to ensure a better fit!
Scatter graph showing positive correlation
Sales value ($ 000's)
60
50
40
30
20
10
0
0
10
20
30
40
#of outlets visited
50
60
70
24.
Regression Analysisb
n xy x y
n x 2 ( x ) 2
25.
Regression AnalysisRep. no.
1
2
3
4
5
6
7
8
9
10
Total
Value of last quarter’s sales Number of retail outlets
($000s) (y)
visited regularly (x)
10
25
29
31
31
42
44
45
47
57
361
50
12
17
21
26
34
30
38
45
61
334
xy
x^2
500
300
493
651
806
1428
1320
1710
2115
3477
12800
2500
144
289
441
676
1156
900
1444
2025
3721
13296
26.
Regression Analysisb
n xy x y
n x ( x )
2
2
=
10∗12800−334∗361
=
10∗13296−111556
= 36.1 -0.3469*33.4 = 24.512
0.3469
27.
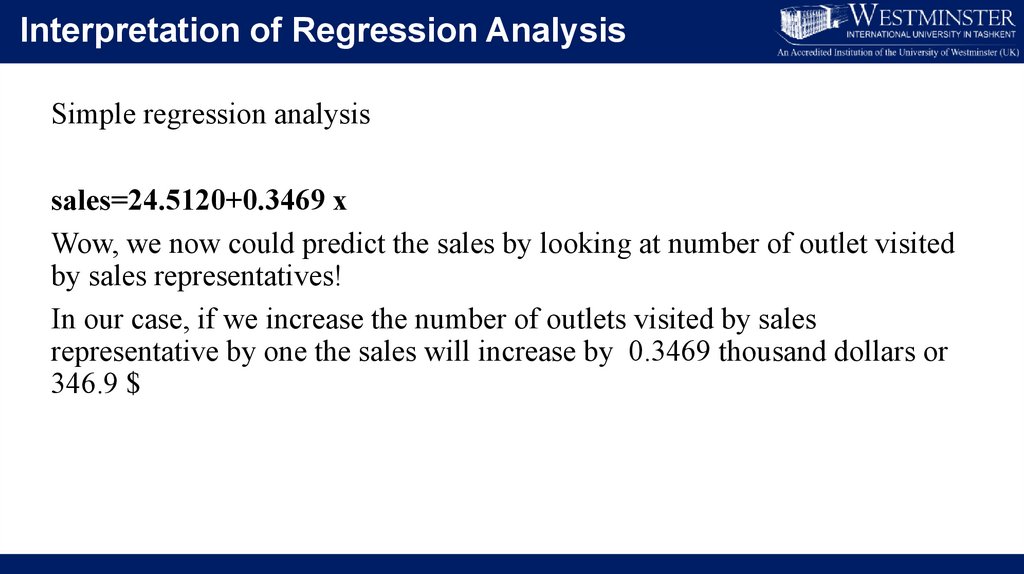
Interpretation of Regression AnalysisSimple regression analysis
sales=24.5120+0.3469 x
Wow, we now could predict the sales by looking at number of outlet visited
by sales representatives!
In our case, if we increase the number of outlets visited by sales
representative by one the sales will increase by 0.3469 thousand dollars or
346.9 $
28.
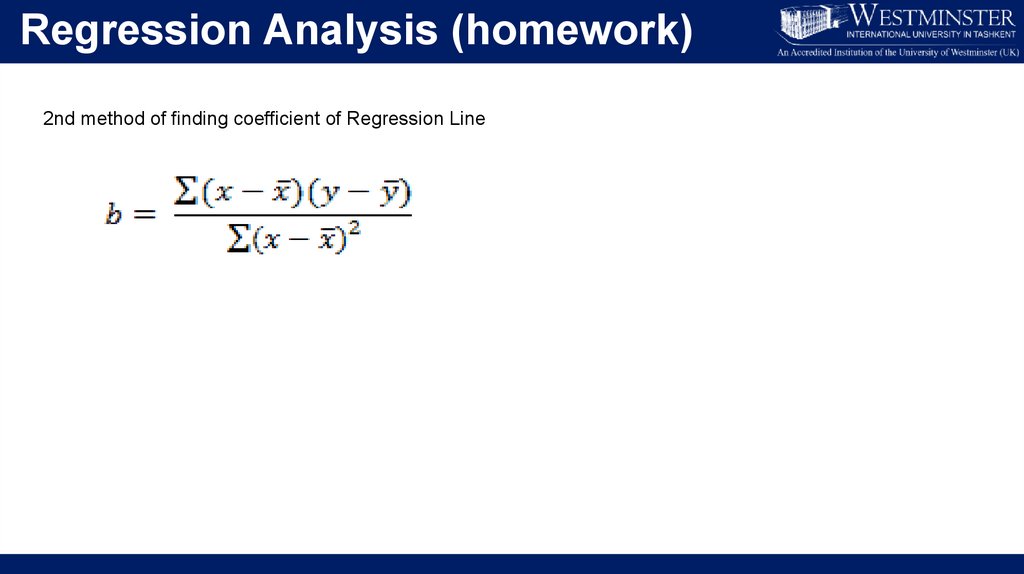
Regression Analysis (homework)2nd method of finding coefficient of Regression Line
29.
Mesuring quality of regression equationCoefficient of determination – R squared – is a statistical measure
of how close the data are to the fitted regression line.
It takes values between 0 and 1, which is the same as 0% and 100
%, respectively.